6.7 Review Exercises
Chapter 6 Review Exercises
1. Consider the following population data:
[latex]2,4,8,4,6,[/latex]
[latex]2,7,8,4,3,[/latex]
[latex]8,9,4,3,5[/latex]
a) Calculate the mean.
b) Calculate the median.
c) Calculate the mode.
d) Calculate the range
e) calculate the standard deviation.
f) Describe the skewness of the data.
Solution
a) [latex]5.13[/latex]
b) [latex]4[/latex]
c) [latex]4[/latex]
d) [latex]7[/latex]
e) [latex]2.28[/latex]
f) right skewed
2. A sample of monthly credit card charges (in dollars) is shown below:
[latex]236,1710,1351,825,7450,[/latex]
[latex]316,4135,1333,1584,387[/latex]
a) Calculate the mean.
b) Calculate the median.
c) Calculate the mode.
d) Calculate range
e) calculate the standard deviation.
f) Describe the skewness of the data.
Solution
a) [latex]$1,932.70[/latex]
b) [latex]$1,342[/latex]
c) no mode.
D) [latex]$7,214[/latex]
e) [latex]$2,242.73[/latex]
f) right skewed.
3. People visiting video rental stores often rent more than one DVD at a time. The probability distribution for DVD rentals per customer at Video To Go is given in the following table. There is a five-video limit per customer at this store, so nobody ever rents more than five DVDs.
| [latex]x[/latex] | [latex]P(x)[/latex] |
| [latex]0[/latex] | [latex]0.03[/latex] |
| [latex]1[/latex] | [latex]0.50[/latex] |
| [latex]2[/latex] | [latex]0.24[/latex] |
| [latex]3[/latex] | |
| [latex]4[/latex] | [latex]0.07[/latex] |
| [latex]5[/latex] | [latex]0.04[/latex] |
a) Describe the random variable [latex]x[/latex].
b) Find the probability that a customer rents three DVDs.
c) Find the probability that a customer rents at least four DVDs.
d) Find the probability that a customer rents at most two DVDs.
Solution
a) The number of DVDs a given customer is currently renting.
b) [latex]1-0.03-0.50-0.24-0.07-0.04=0.09[/latex]
c) [latex]0.07+0.04=0.11[/latex]
d) [latex]0.03+0.50+0.24=0.77[/latex]
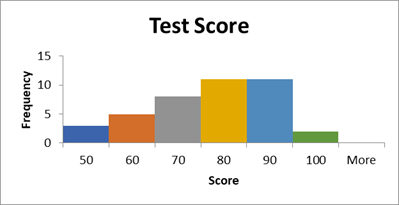
4. The following are the grades for 40 students on an accounting test:
75 89 66 52 90 68 83 84 77 60
98 47 87 65 87 49 65 72 73 81
53 77 41 88 74 97 85 76 74 63
69 72 81 87 76 58 63 70 72 55
(a) Calculate the range for this data.
(b) Calculate class width (round up to the next whole number) for constructing frequency distribution table.
(c) Start the minimum number 41 as the lower limit of the first class. What are the upper limits for the frequency distribution table?
(d) Construct a frequency distribution table with classes, frequency, relative frequencies, cumulative frequencies and cumulative relative frequencies.
(e) Construct the histogram corresponding to the table in part (d).
(f) Calculate mean of this data.
(g) Calculate the mode for this data.
(h) Calculate the median for this data.
(i) Describe skewness of this data
Solution
a. 57
b. 10
c. 50, 60, 70, 80, 100
d.
| Lower Class Limit | Upper Class Limit | Frequency | Relative Frequency | Cumulative Frequency | Relative Cumulative Frequency |
|---|---|---|---|---|---|
| 41 | 50 | 3 | 8% | 3 | 0.075 |
| 51 | 60 | 5 | 13% | 8 | 20% |
| 61 | 70 | 8 | 20% | 16 | 40% |
| 71 | 80 | 11 | 28% | 27 | 68% |
| 81 | 90 | 11 | 28% | 38 | 95% |
| 91 | 100 | 2 | 5% | 40 | 100% |
f. Mean: 72.48
g. Median: 73.5
h. Mode: 87, 72
i. Skew to the left
5. Consider the following sample data:
2 7 8 4 3
8 9 4 3 5
(a) Calculate the mean.
(b) Calculate the median.
(c) Calculate the mode.
(d) Calculate the range.
(e) Calculate the standard deviation.
(f) Describe the skewness of the data.
Solution
a. 5.3
b. 4.5
c. 8, 4, 3
d. 7
e. 2.50
f. positively skewed since the mean is greater than the median.
6. A sample of monthly credit card charges (in dollars) is shown below:
316 4135 133 1584 387
(a) Calculate the mean monthly credit card charge.
(b) Calculate the median monthly credit card charge.
(c) Calculate the mode.
(d) Calculate the standard deviation.
(e) Describe the skewness of the data.
Solution
a. $1311
b. $387
c. No mode
d. $1679.36
e. Skew to the right
7. A sample of students who graduated with student loan debt is shown below. The data is in thousands of dollars.
12.2 2 11.5 17.8 4
(a) Calculate the mean loan debt.
(b) What is the median loan debt?
(c) What is the mode?
(d) Describe the skewness of this data.
(e) Calculate the standard deviation?
Solution
a. $9,500
b. $11,500
c. No mode
d. negatively skewed since the mean is smaller than the median
e. $6,455.23
8. The following data show the annual salary, in thousands of dollars, for superintendents in 20 school districts in Rochester, New York.
187 175 165 162 172
184 172 208 172 175
174 202 215 182 170
185 197 164 156 183
(a) Construct a frequency distribution table for this data.
(b) Construct the histogram corresponding to the table in part (a).
(c) Based on the histogram, what measure of central tendency best describes this data?
Attribution
"Chapter 4 Homework" from Introductory Statistics by OpenStax Rice University is licensed under a Creative Commons Attribution 4.0 International License.


