Appendix 1: Software Solutions
Descriptive Statistics: Data
| Variable | N | N* | Mean | SE Mean | StDev | Variance | CoefVar | Minimum | Q[latex]1[/latex] |
| Dara | [latex]11[/latex] | [latex]0[/latex] | [latex]32.27[/latex] | [latex]4.83[/latex] | [latex]16.03[/latex] | [latex]256.82[/latex] | [latex]29.66[/latex] | [latex]5.00[/latex] | [latex]20.00[/latex] |
| Variable | Median | Q[latex]3[/latex] | Maximum | IQR |
| Data | [latex]35.00[/latex] | [latex]45.00[/latex] | [latex]55.00[/latex] | [latex]25.00[/latex] |
Excel
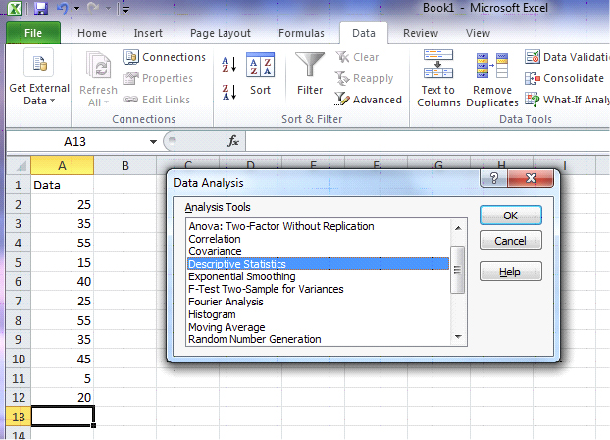
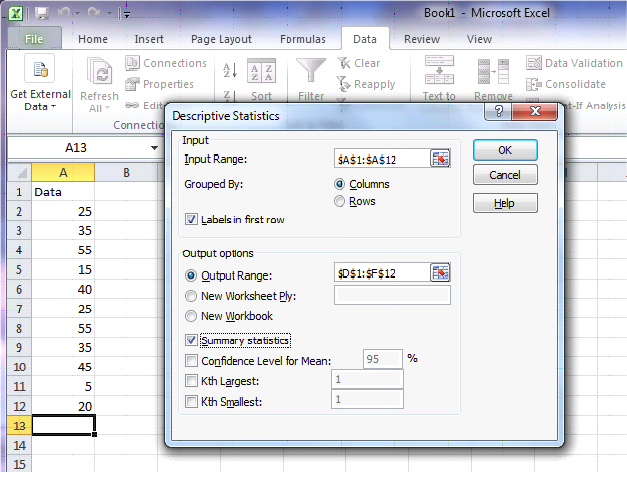
Open up Excel and enter the data in the first column of the spreadsheet. Select DATA > Data Analysis > Descriptive Statistics. For the input range, select data in column A. Check "Labels in First Row" and "Summary Statistics". Also, check "Output Range" and select a location for output.
Image Description
The image depicts a Microsoft Excel [latex]2010[/latex] interface with the "Data" tab active. There is an open "Data Analysis" dialog box at the center, displaying a list of analysis tools. "Descriptive Statistics" is selected from the list.Visible Ribbon Tabs and Buttons:
- The active "Data" tab shows options like:
- Get External Data
- Connections
- Sort & Filter
- Data Tools
- Outline
- Buttons under "Get External Data": Fetch Data, Refresh All
- Buttons under "Connections": Connections, Properties, Edit Links
- Buttons under "Sort & Filter": Sort A to Z, Sort Z to A, Advanced
- Buttons under "Data Tools": Text to Columns, Remove Duplicates, Data Validation, Consolidate, What-If Analysis
Open "Data Analysis" Dialog Box:
| Options |
|---|
| Anova: Two-Factor Without Replication |
| Correlation |
| Covariance |
| Descriptive Statistics |
| Exponential Smoothing |
| F-Test Two-Sample for Variances |
| Fourier Analysis |
| Histogram |
| Moving Average |
| Random Number Generation |
- Buttons within the dialog box: OK, Cancel, Help
Excel Sheet:
- Sheet name: "Book1 - Microsoft Excel"
- Selected cell: [latex]A13[/latex]
- Worksheet data in column [latex]A[/latex]:
- [latex]A1: Data[/latex]
- [latex]A2: 25[/latex]
- [latex]A3: 25[/latex]
- [latex]A4: 30[/latex]
- [latex]A5: 55[/latex]
- [latex]A6: 15[/latex]
- [latex]A7: 35[/latex]
- [latex]A8: 65[/latex]
- [latex]A9: 35[/latex]
- [latex]A10: 25[/latex]
- [latex]A11: 55[/latex]
- [latex]A12: 20[/latex]
Image Description
The image shows a screenshot of a Microsoft Excel application. In the background, a worksheet titled "Book1" is open, with column headers labeled "[latex]A[/latex]" and "[latex]B[/latex]". The worksheet contains a column of numerical data under column "[latex]A[/latex]," specifically labeled "Data" in cell [latex]A1[/latex], with values [latex]25[/latex], [latex]35[/latex], [latex]45[/latex], [latex]50[/latex], [latex]55[/latex], [latex]65[/latex], [latex]75[/latex], [latex]85[/latex], [latex]95[/latex], and [latex]105[/latex] in cells [latex]A2[/latex] through [latex]A11[/latex]. Cell [latex]A12[/latex] is empty, and cell [latex]A13[/latex] is highlighted. Column [latex]B[/latex] is empty.
In the foreground, a "Descriptive Statistics" dialog box is open. The dialog box is divided into two main sections:
[latex]1[/latex]. Input:
- Input Range: `[latex]$A$1:$A$12[/latex]`
- Grouped By: Columns (selected)
- A checkbox labeled "Labels in first row" is checked.
[latex]2[/latex]. Output options:
- Output Range: `[latex]$D$1:$F$12[/latex]`
- Radio buttons for `Output Range` (selected), `New Worksheet Ply`, and `New Workbook`.
- A checkbox for "Summary statistics" is checked.
- Fields with labels for "Confidence Level for Mean:" set to [latex]95%[/latex], and fields for "[latex]K^{th}[/latex] Largest" and "[latex]K^{th}[/latex] Smallest" both set to [latex]1[/latex].
On the right side of the dialog box, there are three buttons: `OK`, `Cancel`, and `Help`. The Excel Ribbon is visible at the top with various tabs like File, Home, Insert, Page Layout, Formulas, Data, Review, and View. The "Data" tab is currently selected, displaying options such as Connections, Sort, Filter, Data Tools, and Outline.
| Data | |
|---|---|
| Mean | [latex]32.27273[/latex] |
| Standard Error | [latex]4.831884[/latex] |
| Median | [latex]35[/latex] |
| Mode | [latex]25[/latex] |
| Standard Deviation | [latex]16.02555[/latex] |
| Sample Variance | [latex]256.8182[/latex] |
| Kurtosis | [latex]-0.73643[/latex] |
| Skewness | [latex]-0.05982[/latex] |
| Range | [latex]50[/latex] |
| Minimum | [latex]5[/latex] |
| Maximum | [latex]55[/latex] |
| Sum | [latex]355[/latex] |
| Count | [latex]11[/latex] |
Attribution
"Chapter 1: Descriptive Statistics and the Normal Distribution" from Natural Resources Biometrics by Diane Kiernan is licensed under a Creative Commons Attribution-NonCommercial 4.0 International License, except where otherwise noted.


