6.1 Descriptive Statistics
Learning Objectives
- Explain the difference between population and sample.
- Differentiate quantitative and continuous variables.
Formula & Symbol Hub
Symbols Used
- [latex]\mu[/latex] = Population Mean
- [latex]\bar{x}[/latex] = Sample Mean
- [latex]σ^2[/latex] = Population Variance
- [latex]s^2[/latex] = Sample Variance
A population is the group to be studied, and population data is a collection of all elements in the population. For example:
- All the fish in Long Lake.
- All the lakes in the Adirondack Park.
- All the grizzly bears in Yellowstone National Park.
A sample is a subset of data drawn from the population of interest. For example:
- [latex]100[/latex] fish randomly sampled from Long Lake.
- [latex]25[/latex] lakes randomly selected from the Adirondack Park.
- [latex]60[/latex] grizzly bears with a home range in Yellowstone National Park.
Populations are characterized by descriptive measures called parameters. Inferences about parameters are based on sample statistics. For example, the population mean ([latex]\mu[/latex]) is estimated by the sample mean ([latex]\bar{x}[/latex]). The population variance ([latex]σ^2[/latex]) is estimated by the sample variance ([latex]s^2[/latex]).
Variables are the characteristics we are interested in. For example:
- The length of fish in Long Lake.
- The pH of lakes in the Adirondack Park.
- The weight of grizzly bears in Yellowstone National Park.
Variables are divided into two major groups: qualitative and quantitative. Qualitative variables have values that are attributes or categories. Mathematical operations cannot be applied to qualitative variables. Examples of qualitative variables are gender, race, and petal colour. Quantitative variables have values that are typically numeric, such as measurements. Mathematical operations can be applied to these data. Examples of quantitative variables are age, height, and length.
Quantitative variables can be broken down further into two more categories: discrete and continuous variables. Discrete variables have a finite or countable number of possible values. Think of discrete variables as “hens.” Hens can lay [latex]1[/latex] egg, or [latex]2[/latex] eggs, or [latex]13[/latex] eggs… There is a limited, definable number of values that the variable could take on.

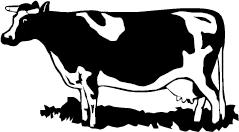
Continuous variables have an infinite number of possible values. Think of continuous variables as “cows.” Cows can give [latex]4.6713245[/latex] gallons of milk, or [latex]7.0918754[/latex] gallons of milk, or [latex]13.272698[/latex] gallons of milk … There are an almost infinite number of values that a continuous variable could take on.
Try It
Is the variable qualitative or quantitative?
| Species | Weight | Diameter | Zip Code |
Solution
| Qualitative | Quantitative | Quantitative | Qualitative |
Attribution
"Chapter 1: Descriptive Statistics and the Normal Distribution" from Natural Resources Biometrics by Diane Kiernan is licensed under a Creative Commons Attribution-NonCommercial 4.0 International License, except where otherwise noted.
