6.0 Introduction
Chapter Learning Objectives
By the end of the chapter, you should be able to:
- Explain the difference between population and sample.
- Differentiate quantitative and continuous variables.
- Display data using a histogram.
- Analyze and interpret data presented in a graph.
- Calculate the mean, median, mode, range, variance, standard deviation, Standard Error of the Means, and Coefficient of Variation for any population or sample.
- Identify symmetric distribution and skewed sets.
- Identify the shape of a set of data.
- Recognize, describe, calculate, and interpret the measures of location of data: quartiles and percentiles.
- Contrast how you can represent data. Know what data sets and purposes would incline you to use one over another.
Statistics has become the universal language of the sciences, and data analysis can lead to powerful results. As scientists, researchers, and managers working in the natural resources sector, we all rely on statistical analysis to help us answer the questions that arise in the populations we manage. For example:
- Has there been a significant change in the mean saw timber volume in the red pine stands?
- Has there been an increase in the number of invasive species found in the Great Lakes?
- What proportion of white-tail deer in New Hampshire have weights below the limit considered healthy?
- Did fertilizer A, B, or C have an effect on the corn yield?
These are typical questions that require statistical analysis for the answers. In order to answer these questions, a good random sample must be collected from the population of interest. We then use descriptive statistics to organize and summarize our sample data. The next step is inferential statistics, which allows us to use our sample statistics and extend the results to the population while measuring the reliability of the result. However, before we begin exploring different types of statistical methods, a brief review of descriptive statistics is needed.
Statistics is the science of collecting, organizing, summarizing, analyzing, and interpreting information.
Good statistics come from good samples and are used to draw conclusions or answer questions about a population. We use sample statistics to estimate population parameters (the truth). So, let’s begin there…
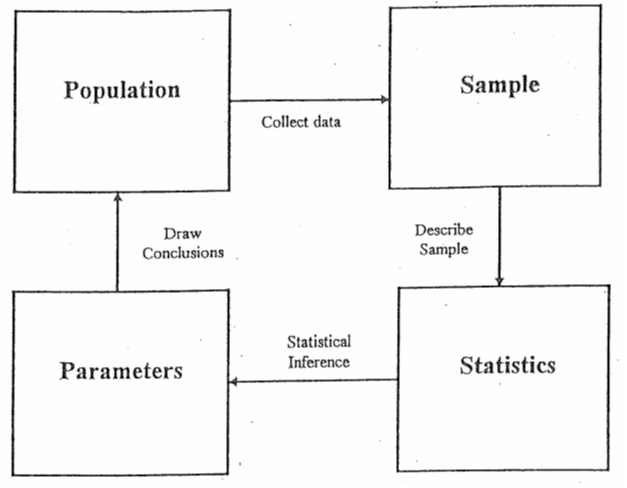
Image Description
This image is a flowchart depicting the relationship between four concepts: Population, Sample, Statistics, and Parameters. Each concept is represented as a labelled box.
- Population box is placed at the top-left corner.
- Sample box is placed at the top-right corner.
- Parameters box is placed at the bottom-left corner.
- Statistics box is placed at the bottom-right corner.
Arrows are used to show the flow between these concepts:
- An arrow labelled “Collect data” points from Population to Sample.
- An arrow labelled “Describe Sample” points from Sample to Statistics.
- An arrow labeled “Statistical Inference” points from Statistics to Parameters.
- An arrow labelled “Draw Conclusions” points from Parameters to Population.
Attribution
“Chapter 1: Descriptive Statistics and the Normal Distribution” from Natural Resources Biometrics by Diane Kiernan is licensed under a Creative Commons Attribution-NonCommercial 4.0 International License, except where otherwise noted.
