2.6: Second Derivative and Concavity
Second Derivative and Concavity
Graphically, a function is concave up if its graph is curved with the opening upward (Figure 1a). Similarly, a function is concave down if its graph opens downward (Figure 1b).
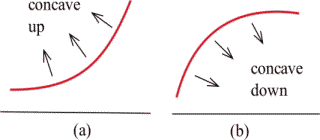
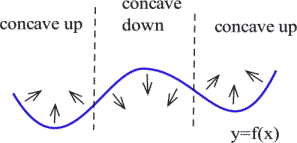
This figure shows the concavity of a function at several points. Notice that a function can be concave up regardless of whether it is increasing or decreasing.
For example, an epidemic : Suppose an epidemic has started, and you, as a member of congress, must decide whether the current methods are effectively fighting the spread of the disease or whether more drastic measures and more money are needed. In Figure 2 below, [latex]f(x)[/latex] is the number of people who have the disease at time [latex]x[/latex], and two different situations are shown. In both Figure 2a and Figure 2b, the number of people with the disease, [latex]f(\text{now})[/latex], and the rate at which new people are getting sick, [latex]f'(\text{now})[/latex], are the same. The difference in the two situations is the concavity of [latex]f[/latex], and that difference in concavity might have a big effect on your decision.
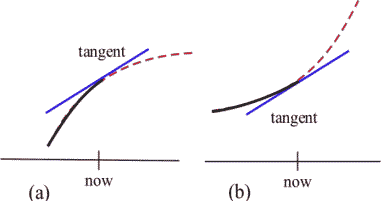
In Figure 2a, [latex]f[/latex] is concave down at “now”, the slopes are decreasing, and it looks as if it is tailing off. We can say “[latex]f[/latex] is increasing at a decreasing rate.” It appears that the current methods are starting to bring the epidemic under control.
In Figure 2b, [latex]f[/latex] is concave up, the slopes are increasing, and it looks as if it will keep increasing faster and faster. It appears that the epidemic is still out of control.
The differences between the graphs come from whether the derivative is increasing or decreasing.
The derivative of a function f is a function that gives information about the slope of [latex]f[/latex]. The derivative tells us if the original function is increasing or decreasing .
Because [latex]f'[/latex] is a function, we can take its derivative. This second derivative also gives us information about our original function [latex]f[/latex]. The second derivative gives us a mathematical way to tell how the graph of a function is curved. The second derivative tells us if the original function is concave up or down.
Video Demonstration
Concavity
© 2014 Eric Bancroft
Second Derivative
Consider a function [latex]f(x)[/latex].
The second derivative of [latex]f[/latex] is the derivative of [latex]f'(x)[/latex].
Using prime notation, this is [latex]f''(x)[/latex]. You can read this aloud as f double prime of x.
Using Leibniz notation, the second derivative is written [latex]\frac{d^2y}{dx^2}[/latex]. This is read aloud as the second derivative of f with respect to x.
Derivatives and the Graph of a Function
The first derivative tells us if a function is increasing or decreasing.
The second derivative tells us if a function is concave up or concave down
The first derivative:
If [latex]f'(x)[/latex] is positive on an interval, the graph of [latex]f(x)[/latex] is increasing on that interval.
If [latex]f'(x)[/latex] is negative on an interval, the graph of [latex]f(x)[/latex] is decreasing on that interval.
The second derivative:
If [latex]f''(x)[/latex] is positive on an interval, the graph of [latex]y=f(x)[/latex] is concave up on that interval. We can say that [latex]f[/latex] is increasing (or decreasing) at an increasing rate.
If [latex]f''(x)[/latex] is negative on an interval, the graph of [latex]y=f(x)[/latex] is concave down on that interval. We can say that [latex]f[/latex] is increasing (or decreasing) at a decreasing rate
Example 1
Find [latex]f''(x)[/latex] for [latex]f(x)=3x^7[/latex].
Answer:
Since [latex]f''=(f')'[/latex], we have to start with calculating the first derivative.
[latex]f'(x)=3\cdot 7x^{7-1}=21x^6[/latex]
The second derivative is the derivative of the first derivative and so we have
[latex]f'(x)=21\cdot 6x^{6-1}=126x^5[/latex]
You are likely experiencing the second derivative every day! If [latex]f(x)[/latex] represents the position of a particle at time [latex]x[/latex], then [latex]v(x) = f '(x)[/latex] will represent the velocity (rate of change of the position) of the particle and [latex]a(x) = v '(x) = f ''(x)[/latex] will represent the acceleration (the rate of change of the velocity) of the particle.
You are probably familiar with acceleration from driving or riding in a car. The speedometer tells you your velocity (speed). When you leave from a stop and press down on the gas pedal, you are accelerating – increasing your speed. The curve that would describe your position over that time period would be concave up. However, if you were slowing down to a stop, you would be decreasing your speed, and the curve describing your position while you are slowing down would be concave down.
Let’s consider an example in business.
Example 2
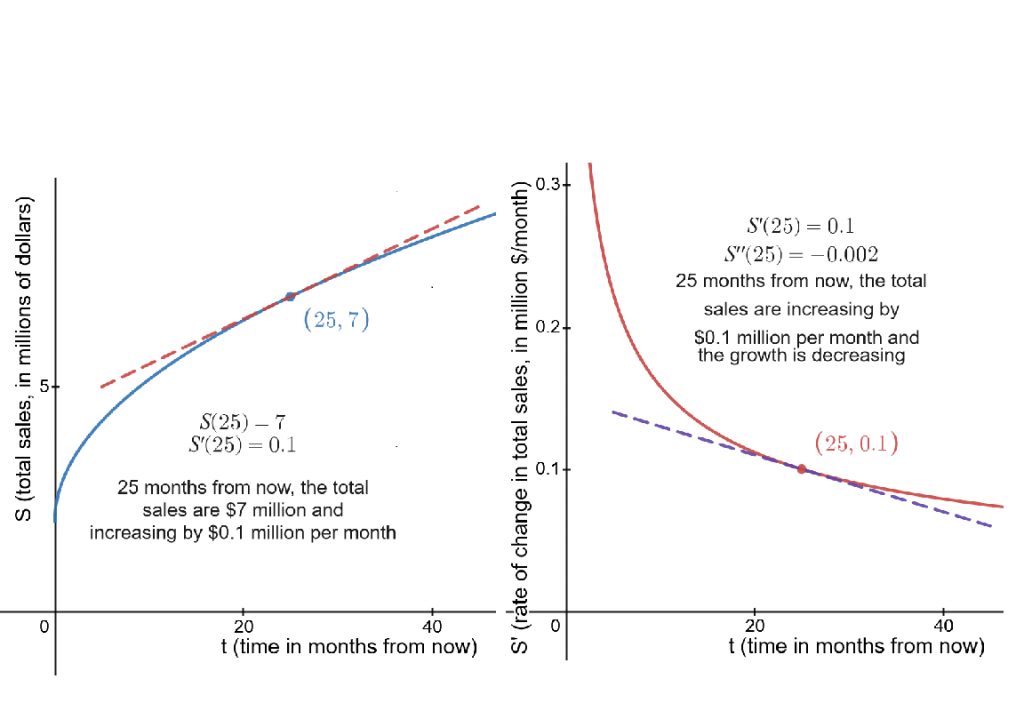
A company’s total sales [latex]S[/latex] (in millions of dollars) [latex]t[/latex] months from now are given by [latex]S(t)=\sqrt{t}+2[/latex].
a. Find [latex]S'(t)[/latex] and [latex]S''(t)[/latex].
b. Calculate [latex]S'(25)[/latex] and interpret the meaning of the result.
Answer:
a. Since [latex]S(t)=\sqrt{t}+2=t^{1/2}+2[/latex],
[latex]S'(t)=\frac{1}{2}t^{1/2-1}+0=\frac{1}{2}t^{-1/2}[/latex]
and
[latex]S''(t)=\frac{1}{2}\left(\frac{1}{2}\right)t^{-1/2-1}=-\frac{1}{4}t^{-3/2}[/latex]
b. Using the results from a., we have
[latex]S'(25)=\frac{1}{2}25^{-1/2}=0.1[/latex]
and
[latex]S''(25)=-\frac{1}{4}25^{-3/2}=-0.002[/latex]
Therefore, 25 months from now, the company’s total sales are increasing by $0.1 million, or $100,000, per month. At the same time, the rate of change in company’s total sales, or the sales growth, is decreasing by $0.002 million ($2,000) per month.
Inflection Points
Example 3
Which of the labeled points in the graph below are inflection points?
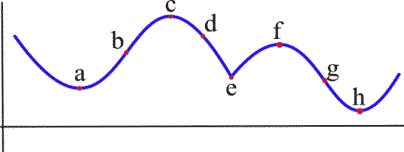
Answer:
The concavity changes at points b and g.
At points a and h, the graph is concave up on both sides, so the concavity does not change.
At points c and f, the graph is concave down on both sides.
At point e, even though the graph looks strange there, the graph is concave down on both sides – the concavity does not change.
Working Definition
An inflection point is a point on the graph where the second derivative changes sign.
Example 4
Let [latex]f(x) = x^3[/latex], [latex]g(x) = x^4[/latex] and [latex]h(x) = x^{1/3}[/latex]. For which of these functions is the point [latex](0,0)[/latex] an inflection point?
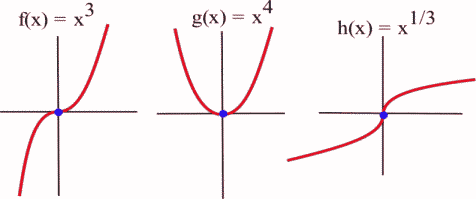
Answer:
Graphically, it is clear that the concavity of [latex]f(x) = x^3[/latex] and [latex]h(x) = x^{1/3}[/latex] changes at (0,0), so (0,0) is an inflection point for [latex]f[/latex] and [latex]h[/latex]. The function [latex]g(x) = x^4[/latex] is concave up everywhere so (0,0) is not an inflection point of [latex]g[/latex].
We can also compute the second derivatives and check the sign change.
If [latex]f(x) = x^3[/latex], then [latex]f'(x) = 3x^2[/latex] and [latex]f''(x) = 6x[/latex]. The only point at which [latex]f''(x) = 0[/latex] or is undefined ([latex]f'[/latex] is not differentiable) is at [latex]x = 0[/latex]. If [latex]x \lt 0[/latex], then [latex]f ''(x) \lt 0[/latex] so [latex]f[/latex] is concave down.
If [latex]x \gt 0[/latex], then [latex]f''(x) \gt 0[/latex] so [latex]f[/latex] is concave up. At [latex]x = 0[/latex] the concavity changes so the point [latex](0,f(0)) = (0,0)[/latex] is an inflection point of [latex]f(x)=x^3[/latex].
If [latex]g(x) = x^4[/latex], then [latex]g'(x) = 4x^3[/latex] and [latex]g''(x) = 12x^2[/latex]. The only point at which [latex]g''(x) = 0[/latex] or is undefined is at [latex]x = 0[/latex].
If [latex]x \lt 0[/latex], then [latex]g''(x) \gt 0[/latex] so [latex]g[/latex] is concave up. If [latex]x \gt 0[/latex], then [latex]g ''(x) \gt 0[/latex] so [latex]g[/latex] is also concave up. At [latex]x = 0[/latex] the concavity does not change so the point [latex](0, g(0)) = (0,0)[/latex] is not an inflection point of [latex]g(x)=x^4[/latex]. Keep this example in mind!
If [latex]h(x) = x^{1/3}[/latex], then [latex]h'(x) = \frac{1}{3}x^{-2/3}[/latex] and [latex]h''(x) = -\frac{2}{9}x^{-5/3}[/latex].
[latex]h''[/latex] is not defined if [latex]x = 0[/latex], but [latex]h''(\text{negative number}) \gt 0[/latex] and [latex]h''(\text{positive number}) \lt 0[/latex] so [latex]h[/latex] changes concavity at (0,0) and (0,0) is an inflection point of [latex]h[/latex].
Video Demonstration
Inflection points
© 2014 Eric Bancroft
Example 5
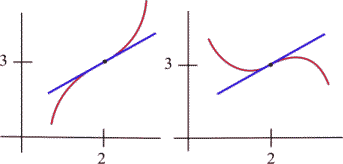
Sketch an example of a graph of a function with [latex]f(2) = 3[/latex], [latex]f '(2) = 1[/latex], and an inflection point at (2,3).
Answer: Two possible solutions are shown here.