9 Plotting 2D and 3D Functions
For a quick 2-D plot representation the context panel can be easily used. Enter the function into MapleTA select Plots and then 2-D plots from the context panel.
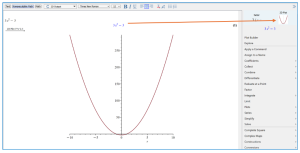
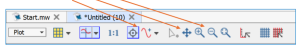
The 2-D plot can be adjusted to probe, pan, & zoom using the toolbar that appears after clicking on the new plot.
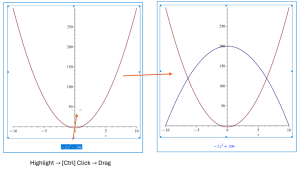
You can add multiple plots on the same graph by entering a new equation to the worksheet. Highlighting the output then holding the [Ctrl] key down while dragging it onto the previous graph output.
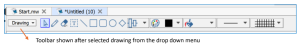
Additional Information can be added to plots by using the drawing tools. Lines, arrows, text are available to be input onto the graph produced.
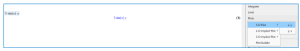
3-D plots can be produced after inputting an equation with two variable present (ex: x & y).
Selecting Plots → 3-D Plots → x,y from the context panel will generate a 3-D graph of the input equation.
The following result will be obtained:
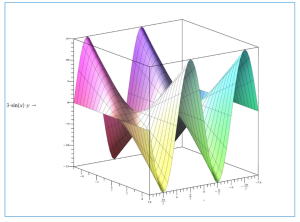
The same toolbar can be used to adjust and manipulate a 3-D plot as used in the 2-D plot.