2.3 Skewness and the Mean, Median, and Mode
LEARNING OBJECTIVES
- Identify the shape of a set of data.
Consider the following data set:
| 4 | 5 | 6 | 6 | 6 | 7 | 7 | 7 |
| 7 | 7 | 7 | 8 | 8 | 8 | 9 | 10 |
This data set can be represented by the following histogram. Each interval has a width of one, and each value is located in the middle of an interval.
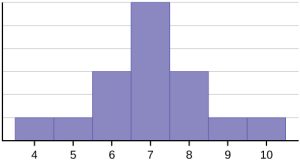
The histogram above displays a symmetrical distribution of data. A distribution is symmetrical if a vertical line can be drawn at some point in the histogram so that the shape to the left and to the right of the vertical line are mirror images of each other. For the above data set, the mean, the median, and the mode are each seven. In a perfectly symmetrical distribution, the mean and the median are the same. This example has one mode, and the mode is the same as the mean and median. In a symmetrical distribution that has multiple modes, the modes would be different from the mean and median.
Consider the following data set:
| 4 | 5 | 6 | 6 | 6 | 7 | 7 | 7 | 7 | 8 |
This data set can be represented by the following histogram. Each interval has a width of one, and each value is located in the middle of an interval.
The histogram above is not symmetrical. The left-hand side seems “chopped off” compared to the right side. A distribution of this type is called skewed to the left because it is pulled out to the left. The mean of this data is [latex]6.3[/latex], the median is [latex]6.5[/latex], and the mode is [latex]7[/latex]. Notice that the mean is less than the median, and they are both less than the mode. The mean and the median both reflect the skewing, but the mean reflects it more so.
Consider the following data set:
| 6 | 7 | 7 | 7 | 7 | 8 | 8 | 8 | 9 | 10 |
This data set can be represented by the following histogram. Each interval has a width of one, and each value is located in the middle of an interval.
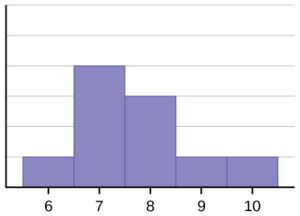
The histogram above is also not symmetrical. In this case, the data is skewed to the right. The mean for this data is [latex]7.7[/latex], the median is [latex]7.5[/latex], and the mode is [latex]7[/latex]. Of the three statistics, the mean is the largest, while the mode is the smallest. Again, the mean reflects the skewing the most.
To summarize:
- If the distribution of the data is symmetrical, then [latex]\text{mean}=\text{median}=\text{mode}[/latex] (assuming there is only one mode). If there are multiple modes in a symmetric distribution, the modes would be different from the mean and the median, but the mean and median would still be equal.
- If the distribution of the data is skewed to the left, then [latex]\text{mean}\lt\text{median}\lt\text{mode}[/latex].
- If the distribution of the data is skewed to the right, then [latex]\text{mean}\gt\text{median}\gt\text{mode}[/latex].
Skewness and symmetry become important when we discuss probability distributions in later chapters.
Video: “Elementary Business Statistics | Skewness and the Mean, Median, and Mode” by Janux [3:58] is licensed under the Standard YouTube License.Transcript and closed captions available on YouTube.
EXAMPLE
Statistics are used to compare and sometimes identify authors. The following list shows a simple random sample that compares the letter counts for three authors.
| Terry | |||||||||
| 7 | 9 | 3 | 3 | 3 | 4 | 1 | 3 | 2 | 2 |
| Davis | |||||||||
| 3 | 3 | 3 | 4 | 1 | 4 | 3 | 2 | 3 | 1 |
| Maris | |||||||||
| 2 | 3 | 4 | 4 | 4 | 6 | 6 | 6 | 8 | 3 |
- Make a dot plot for the three authors and compare the shapes.
- Calculate the mean for each.
- Calculate the median for each.
- Describe any pattern between the shape and the measures of centre.
Solution


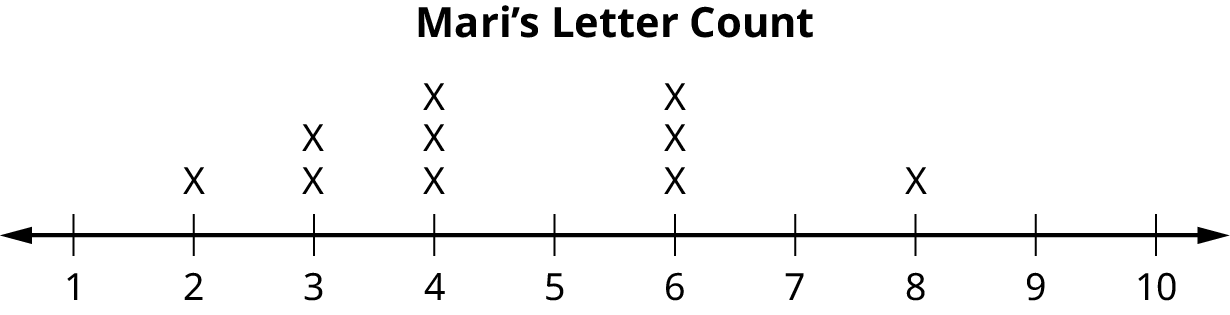
- Terry’s mean is [latex]3.7[/latex], Davis’ mean is [latex]2.7[/latex], Maris’ mean is [latex]4.6[/latex].
- Terry’s median is [latex]3[/latex], Davis’ median is [latex]3[/latex], Maris’ median is [latex]4[/latex].
- It appears that the median is always closest to the high point (the mode), while the mean tends to be farther out on the tail. In a symmetrical distribution, the mean and the median are both centrally located close to the high point of the distribution.
Exercises
- State whether the data are symmetrical, skewed to the left, or skewed to the right.
-
16 17 19 22 22 22 22 22 23 -
87 87 87 87 87 88 89 89 90 91
Click to see Answer
- Left-skewed because the mean ([latex]20.56[/latex]) is less than the median ([latex]22[/latex]).
- Right-skewed because the mean (88.2) is greater than the median ([latex]87.5[/latex]) is greater than the mode ([latex]87[/latex]).
-
- When the data are skewed left, what is the typical relationship between the mean and median?
Click to see Answer
[latex]\mbox{mean} \lt \mbox{median} \lt \mbox{mode}[/latex]
- When the data are symmetrical, what is the typical relationship between the mean and median?
Click to see Answer
[latex]\text{mean}=\text{median}=\text{mode}[/latex]
- Consider the following distribution.

- Describe the shape of this distribution.
- Describe the relationship between the mode and the median of this distribution.
- Describe the relationship between the mean and the median of this distribution.
Click to see Answer
- Right-skewed.
- The mode is less than the median.
- The median is less than the mean.
- Consider the following distribution.

- Describe the relationship between the mode and the median of this distribution.
- Are the mean and the median equal in this distribution? Why or why not?
Click to see Answer
- The mode and the median are equal.
- No, because the distribution is not symmetric.
- Consider the following distribution.

- Describe the shape of this distribution.
- Describe the relationship between the mode and the median of this distribution.
- Describe the relationship between the mean and the median of this distribution.
Click to see Answer
- Left-skewed.
- The median is less than the mode.
- The mean is less than the median.
- The mean and median for the data shown below are the same. Is the data perfectly symmetrical? Why or why not?
3 4 5 5 6 6 6 6 7 7 7 7 7 7 7 Click to see Answer
The data is not perfectly symmetrical. The mean and the median are both [latex]6[/latex], but the mode is [latex]7[/latex].
- Of the three measures, which tends to reflect skewing the most: the mean, the mode, or the median? Why?
Click to see Answer
The mean because the mean is the measure of central tendency that is most susceptible to extreme values.
- In a perfectly symmetrical distribution, when would the mode be different from the mean and median?
Click to see Answer
When there are multiple modes in the data.


“2.4 Skewness and the Mean, Median, and Mode” and “2.7 Exercices” from Introduction to Statistics by Valerie Watts is licensed under a Creative Commons Attribution-NonCommercial-ShareAlike 4.0 International License, except where otherwise noted.
