Look and Feel Guide (Tiramisu)
Exercises (Textbox)
Exercises
Lorem ipsum is placeholder text commonly used in the graphic, print, and publishing industries for previewing layouts and visual mockups. Lorem ipsum is placeholder text commonly used in the graphic, print, and publishing industries for previewing layouts and visual mockups.
Lorem ipsum is placeholder text commonly used in the graphic, print, and publishing industries for previewing layouts and visual mockups.
Learning Objective (Textbox)
Learning Objectives (This heading can be changed according to your choice)
- Lorem ipsum is placeholder text commonly used in the graphic, print, and publishing industries for previewing layouts and visual mockups.
- Lorem ipsum is placeholder text commonly used in the graphic, print, and publishing industries for previewing layouts and visual mockups.
- Lorem ipsum is placeholder text commonly used in the graphic, print, and publishing industries for previewing layouts and visual mockups.
- Lorem ipsum is placeholder text commonly used in the graphic, print, and publishing industries for previewing layouts and visual mockups.
Key Takeaways & Check Your Understanding (Textbox)
Key Takeaways
- Lorem ipsum is placeholder text commonly used in the graphic, print, and publishing industries for previewing layouts and visual mockups.
- Lorem ipsum is placeholder text commonly used in the graphic, print, and publishing industries for previewing layouts and visual mockups.
- Lorem ipsum is placeholder text commonly used in the graphic, print, and publishing industries for previewing layouts and visual mockups.
- Lorem ipsum is placeholder text commonly used in the graphic, print, and publishing industries for previewing layouts and visual mockups.
Examples (Textbox)
Examples
Alternates (Textbox)
Alternates
- Lorem ipsum is placeholder text
- Lorem ipsum is placeholder text
Special (Textbox)
Lorem ipsum is placeholder textLorem ipsum is placeholder text
Lorem ipsum is placeholder textLorem ipsum is placeholder text
Lorem ipsum is placeholder textLorem ipsum is placeholder text
Lorem ipsum is placeholder textLorem ipsum is placeholder text
Lorem ipsum is placeholder textLorem ipsum is placeholder text
Standard (Textbox)
Lorem ipsum is placeholder text commonly used in the graphic, print, and publishing industries for previewing layouts and visual mockups. Lorem ipsum is placeholder text commonly used in the graphic, print, and publishing industries for previewing layouts and visual mockups. Lorem ipsum is placeholder text commonly used in the graphic, print, and publishing industries for previewing layouts and visual mockups.
GeoGebra Style Guide for Vector Diagrams
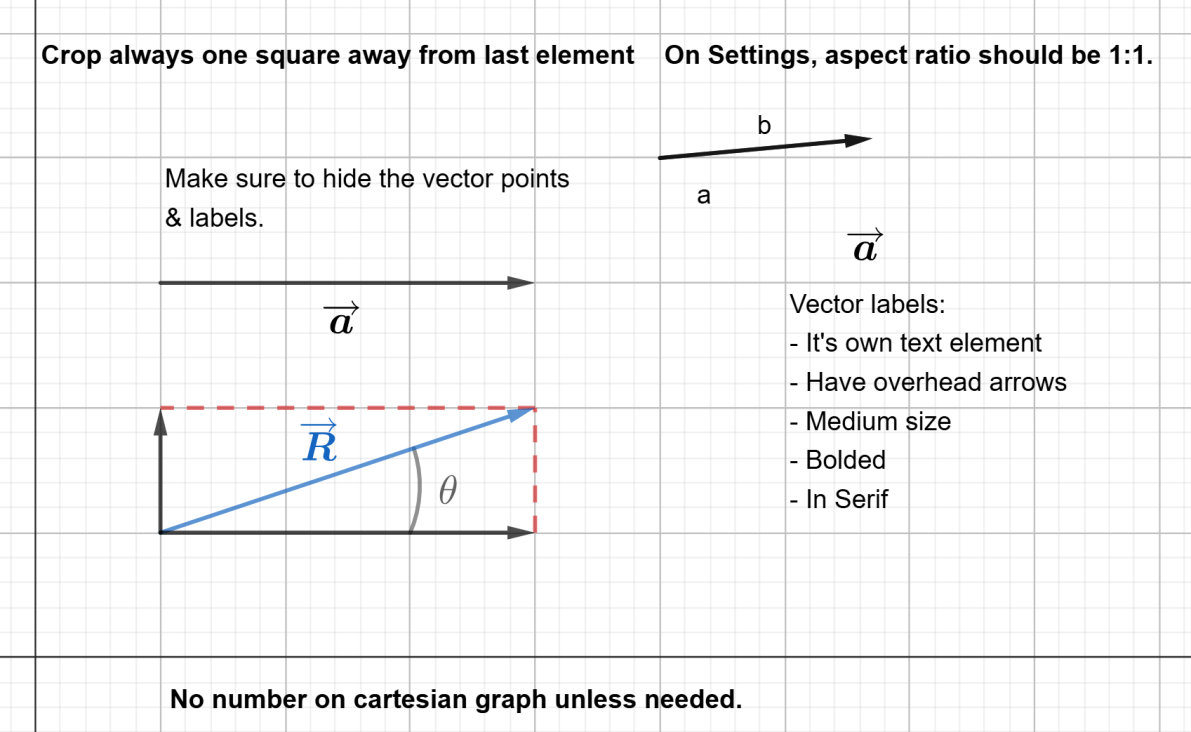
Follow these instructions to create consistent and clear vector diagrams in GeoGebra.
1. Setting Up the Workspace
Show Workspace Set Up
- Set the Axis Ratios
Go to Setting → Basic → Dimensions and set the x-axis: y-axis ratio to 1:1 for a square grid. - Configure Axis Distances
For both the x and y axes, go to Setting → xAxis and Setting → yAxis, then set the Distance to 1 to ensure a uniform scale. - Hide Axis Numbers (Optional)
If your example doesn’t need numbers on the axes, go to Setting → xAxis and Setting → yAxis, then uncheck the Show Numbers box.
2. Creating the Diagram
Show Diagram Creation
- Draw a Vector
Select the Vector tool under Tools → Lines. Use this to create your primary vector. - Create an Angle
Use the Circular Sector tool found under Tools → Circles to create angles as necessary. - Add a Reference Line
For reference lines, use the Segment tool under Tools → Basic Tools or Tools → Lines. - Add Labels
Use the Text tool under Tools → Media to add labels.For vector labels, use LaTeX syntax for an overhead arrow (e.g., \overrightarrow{A} for vector A). Replace A with your vector’s label. - Add x-axis and y-axis (Optional)
If a diagram need you to create your own axis, use the Vector tool to create.
3. Styling Guidelines
Show Guidelines
- Line
Set the line width to 8. Select the Move tool, then click on a line. Use the width slider bar to set the line width to 8. - Vectors and Labels
Set vectors, vector arrows, and labels to black for clarity. - Angles and Labels
Style angles, their lines, and labels in gray. The theta symbol (θ) should be black and bold. - Reference Lines
Set the reference line color to red and make it dotted by selecting the Move tool, click on the line, and choose the first dotted option (to the right of the solid line). - Position Vectors (e.g., R)
Color position vectors in blue for easy identification. - Axis Lines (Exception )
Set the line width to 5. - Hide Points
Use the Show/Hide Object tool under Tools → Edit to hide all points of vectors and lines (note: hidden points cannot be edited). - Text Styling
Use Serif font for non-LaTeX text, set all text to Medium size, and make it bold for readability. - Export and Cropping
After exporting the diagram as an image, crop the image to one small square away from the last element for a clean, consistent layout.