Chapter 6: Trade Restrictions: Arguments for Protection and the Cost of Protection
6.7 The Cost of Protection
We have seen, in the small country-case, that a tariff (and other forms of protection from imports) reduces net national well-being, due primarily to the sum of the production and consumption effects. The actual loss can be greater if an import quota is the policy instrument used for protection and the tariff-equivalent revenue cannot be captured by the government or importers. The loss of economic well-being can also be larger if administrative costs and costs that occur over time – dynamic costs – are taken into account. In evaluating the net national loss, we will focus on the sum of the production and consumption effects, but we recognize this as providing a lower bound to the overall cost of protection.
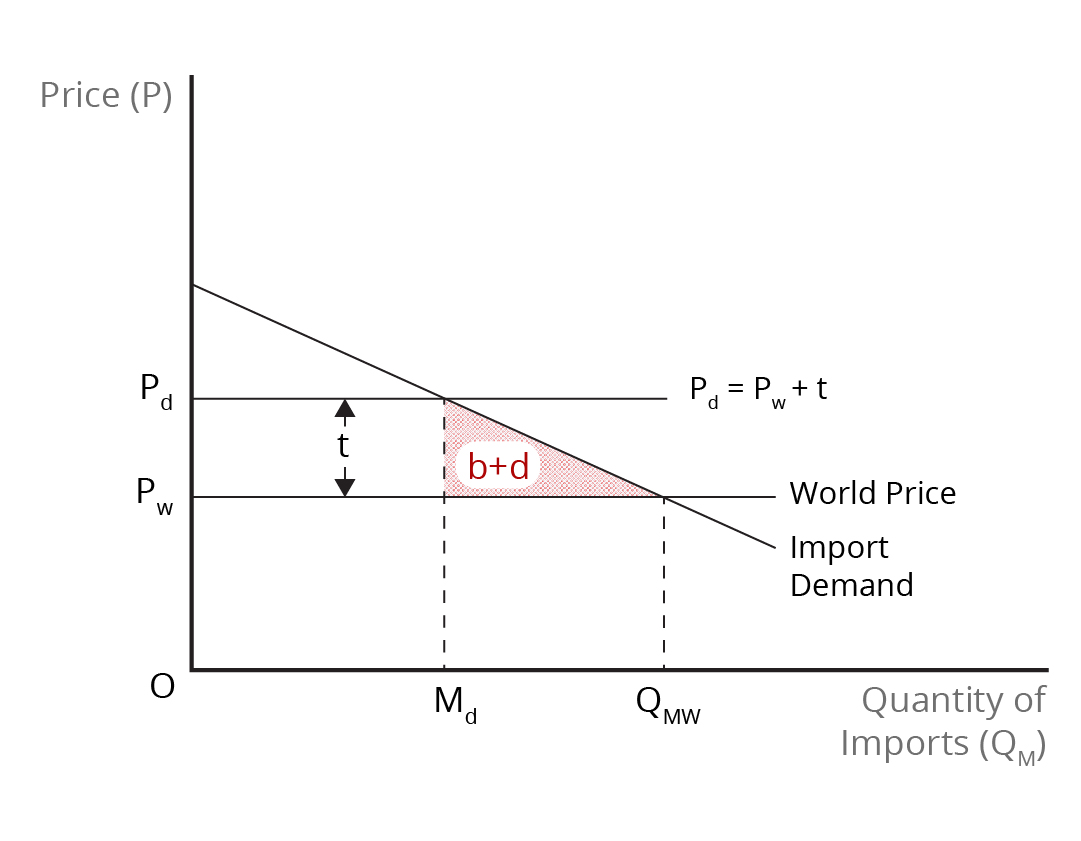
We can estimate the size of the net national loss by calculating the areas that represent the production effect and the consumption effect, combined. The information we require to do so is the tariff [latex](\textit{t})[/latex] and the reduction in imports after the imposition of the tariff. If another policy was used to grant import protection to domestic producers, such as a quota, the tariff-equivalent can be approximated by the difference between the domestic price and the world price. For a small country, the net national loss from tariff protection is given by the following expression:
[latex]\textit{Net National Loss} = \frac{1}{2} * \textit{Tariff} * \textit{Reduction in Import Quantity}[/latex]
This nature of the calculation is indicated graphically in Figure 6.5, where the tariff [latex](\textit{t})[/latex] is equal to [latex]\text{P}_{d}-\text{P}_{w}[/latex] and the reduction in imports is [latex]\text{M}_{w}-\text{M}_{d}[/latex], where [latex]\text{M}_{w}[/latex] is the free-trade quantity of imports and [latex]\text{M}_{d}[/latex] is the quantity of imports after the imposition of the tariff.

Credit: © by Kenrick H. Jordan and Conestoga College, CC BY-NC-SA 4.0.
A familiar way of representing the net national loss is to view it relative to the size of the economy or gross domestic product (GDP). Beginning with the above expression, we can derive an expression for the net national loss as a percent of GDP as follows:
[latex]\textit{Net National Loss} =[/latex][latex]\frac{1}{2}\times\textit{[Reduction in Import Quantity]}\times\textit{[Tariff Rate (%)}\times\textit{Import Price}][/latex]
[latex]\textit{Net National Loss} =[/latex][latex]\frac{1}{2}\times\frac{\textit{[Reduction in Import Quantity]}}{\textit{[Import Quantity]}}\times\textit{[Tariff Rate}\times\textit{Import Price]}\times\textit{[Import Quantity]}[/latex]
[latex]\textit{Net National Loss} =[/latex][latex]\frac{1}{2}\times\textit{[Percent Reduction in Import Quantity]}\times\textit{[Tariff Rate (%)}\times\frac{[\textit{Import Value}]}{\textit{GDP}}[/latex]
Using this last expression, we see that the cost of protection in a developed country is likely to be relatively low for most products that are subject to tariff or other protection. This is because tariffs have been significantly reduced over time under the GATT/WTO and currently stand at average rates of less than 5%. Moreover, for many products, the import value as a share of GDP will likely not be too large. Presuming a 5% tariff rate, a reduction in import quantity of 25%, and that the value of the import represents 10% of GDP, then the overall cost of import protection relative to the size of the economy is quite low at 0.06% of GDP [latex](0.5\times 0.05 \times 0.25 \times 0.1)[/latex]. Note that this estimate is based on a significant reduction in imports and a comparatively high share of the imported product in GDP. As this example shows, the net national loss from import protection is unlikely to be large for countries that have low tariffs and are not particularly dependent on imports.
However, the actual cost of protection may be higher for a number of reasons. First, a country whose imports are subject to import tariffs might retaliate with its own tariffs. Retaliation can lead to an escalation of protection and an eventual fall in trade. Thus, not only will there be a direct increase in the cost of import protection, but additional economic costs will be incurred as exports fall over time. Second, the fact that tariffs or other policies of import protection must be enforced to be effective means that resources that could have been used elsewhere in the economy must now be used for enforcement. As a result, the nation bears the opportunity costs related to enforcement. Third, it is generally true that domestic producers lobby for protection. To the extent that they devote resources to lobbying to increase their economic surplus, this would reduce any producer surplus they eventually get from protection. Moreover, if a quota is used for protection, domestic producers may use resources in order to get the tariff-equivalent revenue, which again increases the net national loss. Other sources of potential national loss are a deterioration in the terms of trade if a VER allows foreign producers to raise their prices and obtain the tariff-equivalent revenue. Last, to the extent that free trade fosters innovation in the import-competing industry, a tariff is likely to have the opposite effect.
Review: Arguments for Protectionism
Review your understanding of trade protectionism by watch this video.
Source: Solina Lindahl. (2018, January 21). International trade arguments for trade protectionism. [Video]. YouTube. https://www.youtube.com/watch?v=qOaur9PSCbE
Image Descriptions
Figure 6.5: Net National Loss Due to an Import Tariff
The image depicts a graph with "Price (P)" labelled on the vertical axis and "Quantity of Imports (QM)" labelled on the horizontal axis. There is a downward-sloping line labelled Import Demand. The world price level is indicated by a horizontal line labelled PW, which intersects the demand curve. Above this, another horizontal line is labelled Pd = PW + t. Between the price lines is a vertical double-arrowed line marked with "t."
Two quantity levels are marked along the horizontal axis, Md and QMW, with dotted vertical lines up to the intersections of the price lines with the demand curve.
Area b + d is a shaded triangle formed by Md, PW, and the Import Demand line.
[back]

