Chapter 6: Trade Restrictions: Arguments for Protection and the Cost of Protection
6.1 The Case for Government Involvement in Protection Against Imports
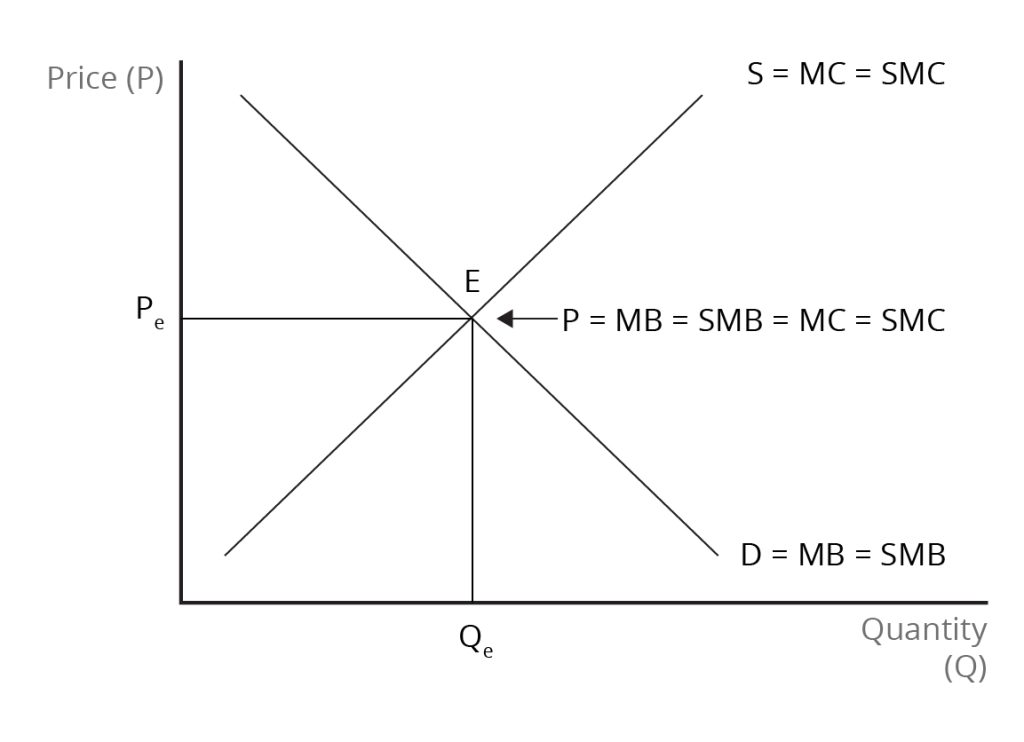
While we will recognize that free trade is usually the best policy, there are often good reasons for adopting policies that protect domestic industries. Formally, these reasons are “second best” because they do not lead to the socially efficient or “first-best” outcomes. “First-best” outcomes imply that private market actions, taken in self-interest, lead to the best outcomes for society because private and social interest coincide. This situation is depicted graphically in Figure 6.1. However, private actions often do not amount to the social interest – that is, the world is not ideal. As a result, we will explore some important second-best arguments for import protection. Moreover, we will highlight that, when faced with having to support domestic industries with second-best policies, governments can often do better than resort to import barriers.

Credit: © by Kenrick H. Jordan and Conestoga College, CC BY-NC-SA 4.0.
In the real world, there are differences between private and social benefits and costs, so private actions do not lead to the best outcomes for society. One important reason for these differences is the fact that markets often fail, leading to either inefficient underproduction or inefficient overproduction. Market failures arise because of a lack of competition, the presence of external costs and benefits, public goods, and inadequate information.
If there is a lack of competition, market participants may influence market outcomes in their favour by restricting production and raising prices relative to their efficient levels. If businesses can ignore external costs, then the market outcome would be inefficient overproduction. Conversely, if external benefits can be obtained without paying for the good, private businesses would produce less than the efficient quantity. There would also be an undersupply of public goods, which are characterized by non-rivalry and non-excludability. Because people can consume the product without reducing the ability of others to simultaneously consume it – non-rivalry – and because it is very difficult to exclude non-paying consumers from consuming the product – non-excludability – there will again be a tendency for too little of the good to be produced.
There are two basic approaches that governments use to address externalities. One is the tax-and-subsidy approach, and the other is the property rights approach. With regard to the former approach, if the social marginal cost (SMC) exceeds the private marginal cost (MC), there are costs being borne by people outside the market transaction. Because businesses can ignore these external costs, too much of the good will be produced and consumed. To bring private and social costs into alignment, the government can impose a tax that’s equivalent to the difference between private and social costs. If external benefits are present, then social marginal benefit (SMB) exceeds private marginal benefit (MB). In this instance, too little of the good will be produced. In order to encourage additional production, the government can provide a subsidy to suppliers.
Externalities often result from a lack of clear property rights. Environmental degradation through pollution, for example, can come about when it is not clear who owns the property rights. When property rights are improperly specified, strong incentives to use resources in ways that maintain their value are lacking. If property rights are clear, the owner of the resource can negotiate with anyone who wants to use it, leading to a mutually beneficial outcome. Therefore, if property rights to an asset are clearly defined and if it is possible for owners and users to bargain, a socially efficient allocation of or the resource will result, regardless of who has the property rights.
Image Descriptions
Figure 6.1: Allocative Efficiency – An Ideal or “First-Best” World
The image is a graph with ‘Price (P)’ labelled on the vertical y-axis and ‘Quantity (Q)’ on the horizontal x-axis. There the supply curve line and demand curve line form an “X” at the centre of the graph. The downward-sloping supply curve line is labelled S = MC = SMC, where ‘MC’ is marginal cost and ‘SMC’ is social marginal cost. The upward-sloping demand curve is labelled D = MB = SMB, where ‘MB’ is marginal benefit and ‘SMB’ is social marginal benefit.
At the intersection of the supply and demand curves the equilibrium point is marked E. A horizontal line extending leftward from point E intersects with the Price axis at Pe. A vertical line dropping down from point E intersects the Quantity axis at Qe. An arrow pointing to E is labelled P = MB = SMB = MC = SMC
[back]
the situation in which private incentives are in full alignment with the benefits and costs to society as a whole
beneficial spillovers to a third party of parties, who did not purchase the good or service that provided the externalities

