Chapter 1: Introduction to Economics of International Trade
1.1 Meaning and Importance of Globalization
Globalization is the process of increasing interdependence among national economies across the globe. Falling barriers to international trade and investment, along with technological change, have promoted globalization. Negotiations among member countries of the General Agreement on Tariffs and Trade (GATT) have cut tariffs on trade from about 60% during the 1930s to 2% to 4% today in advanced countries. Similarly, many countries have reduced or removed barriers to international flows of financial capital and foreign direct investment over the years. In addition, advances in transportation and in information and communication technology have lowered the costs of production, marketing, and distribution, making it easy for businesses to see the world as a single market for their products.
Several key dimensions of globalization are:
- growing international trade in goods and services
- rising cross-border financial flows
- increasing international migration
- a tendency toward economic and cultural homogenization
- a shift in economic activity towards private markets
Growing International Trade in Goods and Services
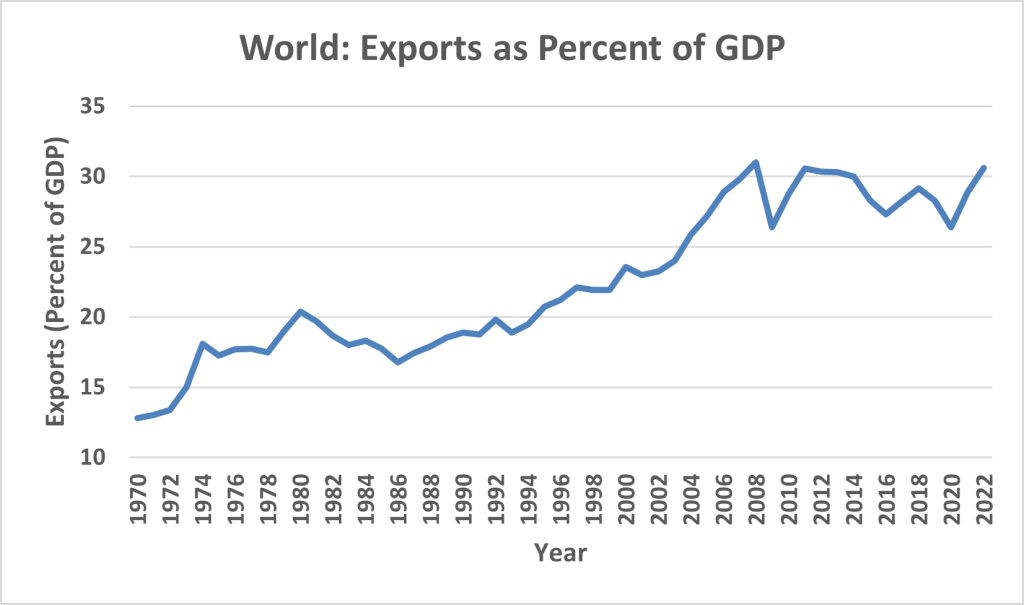
National economies have become increasingly linked through trade. International trade has grown at a much faster pace than world economic output. Over the past 50 years or so, total global economic activity, as measured by GDP, has increased by roughly 3% a year, while total world exports have grown by about 5% annually (World Bank, n.d.). This relatively fast rate of export growth is reflected in an increase in the share of exports in world GDP from 13% in 1970 to 31% in 2022 (see Figure 1.1). Much of this increase in global trade has been intra-industry trade, i.e., two-way trade in which a country exports and imports the same or similar products. For instance, the United States and Canada both export and import a significant amount of motor vehicles and motor vehicle parts. Intra-industry trade occurs more in manufactured products and among advanced countries. The expansion of international trade has also reflected growing intra-firm trade as multinational firms have spread their production and other activities across countries (Dicken, 2015).

Source: Based on data available from the World Bank, DataBank: World Development Indicators.
Credit: © by Kenrick H. Jordan, CC BY-NC-SA 4.0.
Rising Cross-Border Financial Flows
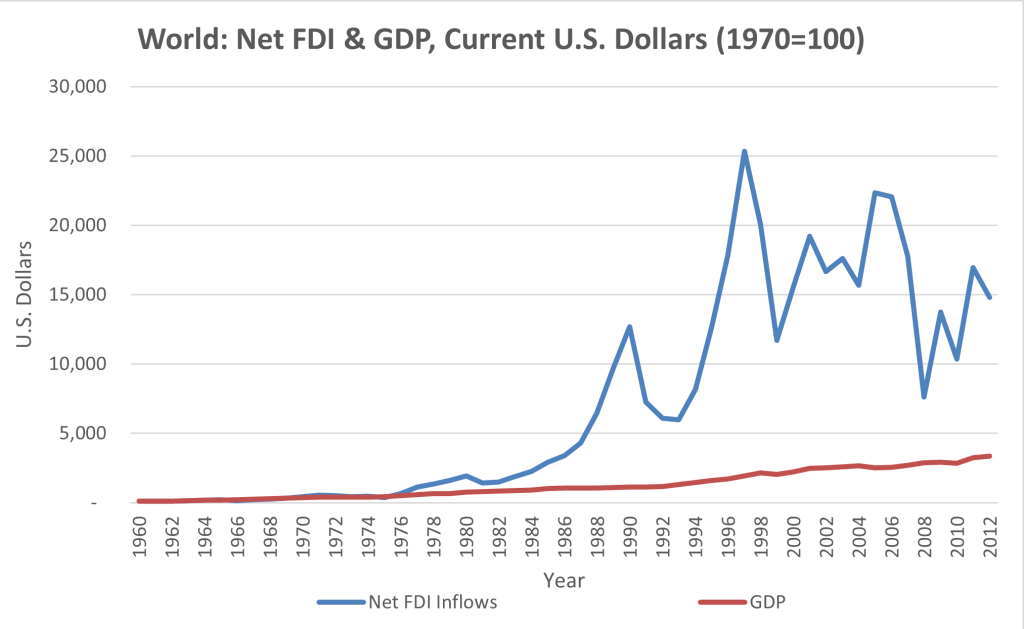
National financial markets have become increasingly integrated as international investors move financial assets rapidly across the world in search of the highest rate of return. International financial flows have been very large – for instance, foreign exchange transactions totalled roughly US$ 7.5 trillion per day in 2022 (Bank for International Settlements, n.d.). Moreover, international financial flows have often been volatile, sometimes leading to large swings in currency values. In addition, foreign direct investment (FDI) has expanded as large and small multinational firms establish subsidiaries around the globe to take advantage of lower costs and emerging market opportunities. Over the past 40 years, the flow of foreign direct investment has grown at a much faster pace than world trade and world output (Hill et al., 2021). Figure 1.2 shows that net inflows of foreign direct investment have risen as a share of world GDP from 0.5% in 1980 to about 2% in 2022.

Source: Based on data available from the World Bank, DataBank: World Development Indicators.
Credit: © by Kenrick H. Jordan, CC BY-NC-SA 4.0.
Increasing International Migration
Another facet of globalization is increasing international migration as people leave their countries of birth in search of better economic opportunities. It is estimated that 3% of the world’s population lives outside of their country of birth (Pugel, 2020). For many advanced countries, the share of the non-native population is quite high – around 15% in the United States and close to 30% in Australia and Switzerland (Pugel, 2020). In the case of Canada, this share was about 22% in 2016 (Statistics Canada, 2017). Immigration has become increasingly contentious as low-skilled resident workers have lost jobs to migrants, and their wages have declined (Carbaugh, 2015). As a result, there have been growing calls in advanced countries for governments to restrict immigration.
A Tendency Toward Economic and Cultural Homogenization
Falling transportation and communications costs are encouraging the movement of products, people, and ideas around the globe. This is helping to make national economies and consumer tastes increasingly similar across countries (Hill et al., 2021; Dicken, 2015). The growing similarity of tastes is aided by the spread of cultural products from developed countries and by global corporations seeking to widen their markets and reduce their production, distribution, and marketing costs. As tastes converge, multinational firms will find it easier to satisfy demand anywhere in the world through standardized products and services. Symbols of cultural homogenization include brands such as McDonalds, Starbucks, Apple, Netflix, and Nike, as well as Hollywood movies and global pop stars.
Shift in Economic Activity towards Free Markets and the Private Sector
As globalization has proceeded, the philosophy of free, private markets has become more prominent, as government regulations have been relaxed and government-owned businesses have been privatized. This trend is more obvious in developing countries where the public sector has often owned and operated businesses that account for substantial parts of their economies. Since the early 1980s, many developing countries have adopted outward-oriented trade policies. At the international level, this shift toward free markets has raised the influence of international agencies like the World Bank and the International Monetary Fund (IMF). Specifically, the IMF has made the liberalization of restrictions on international trade and the privatization of government-owned enterprises conditions of its lending to developing countries.
References
Bank for International Settlements. (n.d.). Welcome to the Bank for International Settlements. https://www.bis.org/
Carbaugh, R.J. (2015). International economics, (15th ed.). Cengage Learning.
Dicken, P. (2015). Global shift: Mapping the changing contours of the world economy, (7th ed.). Guilford Press.
Hill, C.W.L., Hult, T.M., McKaig, T. & Cotae, F. (2021). Global business today, (6th Canadian ed.). McGraw-Hill.
Pugel, T. A. (2020). International economics, (17th ed.). McGraw-Hill.
Statistics Canada. (2017). Focus on geography series, 2016 Census. https://www12.statcan.gc.ca/census-recensement/2016/as-sa/fogs-spg/Index-eng.cfm
The World Bank. (n.d.). DataBank: World Bank indicators. https://databank.worldbank.org/source/world-development-indicators
Image Descriptions
Figure 1.1: World Exports as Percent of GDP
The image is a line graph showing the trend of the world's exports as a percentage of gross domestic product (GDP) from 1970 to 2022. The x-axis represents the years, marked in increments of two years starting from 1970 and ending in 2022. The y-axis represents exports as a percentage of GDP, ranging from 10% to 35%, with markers at every 5%.
The graph features a single line that starts on the left side of the graph at just above the 15% mark in 1970. Initially, the line shows a relatively flat trend with minor undulations until the mid-1980s. From the mid-1980s, the line begins a steady ascent, interrupted by smaller peaks and troughs. This ascent continues, becoming more pronounced from the early 2000s until it reaches a peak at slightly above the 30% mark around 2008. Following this peak, there is a sharp dip, which then recovers and stabilizes. Afterward, the line fluctuates slightly with a broadly upward trend until the end of the graph in 2022, where it sits around the 30% mark once again.
Throughout the graph, the line's path is smooth rather than jagged, suggesting a visualization of annual averages rather than monthly or daily figures.
[back]
Figure 1.2: World: Net Inflows of Foreign Direct Investment as Percent of GDP
The image features a line graph with an x-axis labelled "Year" from 1960 to 2012 in increments of 2 years and a y-axis labelled "U.S. Dollars" with values ranging from 0 to 30,000 in increments of 5,000. The title "World: Net FDI & GDP, Current U.S. Dollars (1970=100)" is positioned at the top of the graph. There are two lines representing different data sets: a blue line labelled "Net FDI Inflows" and a red line labelled "GDP." The blue line shows a volatile pattern with significant fluctuations, representing the net inflows of foreign direct investment (FDI) as a percentage of GDP, beginning at $0 in 1960 with a slow rise to the 1980s, then a series of peaks and valleys, with a high peak in 1996 above $25,000 and ending around $15,000 in 2012. The red line represents the GDP itself and is relatively flat, with a slight upward trend over the years, ending well below $5,000 in 2012.
[back]
the trend in which buying and selling in markets have increasingly crossed national borders, especially by large companies engaging in business in multiple countries
forum in which nations could come together to negotiate reductions in tariffs and other barriers to trade; the precursor to the World Trade Organization
the movement of labour from one region or country to another region or country where they intend to live for substantial period of time
the convergence of cultures, where people across different countries become increasingly attached to the same cultural products, usually originating in dominant countries
an international financial institution that provides loans and grants to the governments of low- and middle-income countries for the purpose of pursuing capital projects
an international organization that promotes global economic growth, financial stability, international trade, and poverty reduction

