6.5 Anaerobic vs Aerobic Metabolism
The chart below compares anaerobic and aerobic metabolic pathways. As shown, each system plays a distinct role depending on the duration of activity and the resources available. Generally speaking, the anaerobic pathways, ATP-CP and Glycolysis, supply the body with ATP and recovery relatively quickly but only provide us enough ATP for short bouts of strenuous activity. Aerobic pathways, however, act differently by providing long-term energy and recovery on an ongoing basis, reducing the system’s recovery duration to nearly zero, all while supplying the body with more efficient ATP production.
Comparing Anaerobic & Aerobic Pathways
| Anaerobic | |||
|---|---|---|---|
| Energy Source | Energy Duration | System Recovery Duration | Net ATP Gain |
| ATP-CP Pathway | 10 to 5 seconds | 2 to 5 minutes | 1 ATP per CP molecule |
| Glycolysis | 1 to 3 minutes | Several minutes to 2 hours | 2 ATP per glucose molecule |
| Aerobic | |||
|---|---|---|---|
| Energy Source | Energy Duration | System Recovery Duration | Net ATP Gain |
| Krebs Cycle | 2 minutes – sustained | Ongoing, no full “shutdown” | 2 ATP per glucose molecule |
| ETC | Sustained | Ongoing, oxygen-dependent | 32 to 34 ATP per glucose molecule |
Fitness Fact

What Energy System am I using?
It is a common misconception that the body only utilizes one energy system at a given time. While you may be engaging in physical activity that can easily be associated with a specific energy system based on the demand it puts on the body, the body is complex and relies on multiple systems in order to maintain ATP levels. For example, when you are running and start to get tired, it is easy to believe that the body “switches” from cellular respiration to glycolysis; however, this is simply untrue. In reality, both aerobic and anaerobic systems are working to meet physical demands for energy.
Energy Systems in Action During Physical Activity
The graph below shows what energy systems are predominantly active during exercise over time. This includes ATP-CP pathway, glycolysis, the Krebs cycle and the ETC.
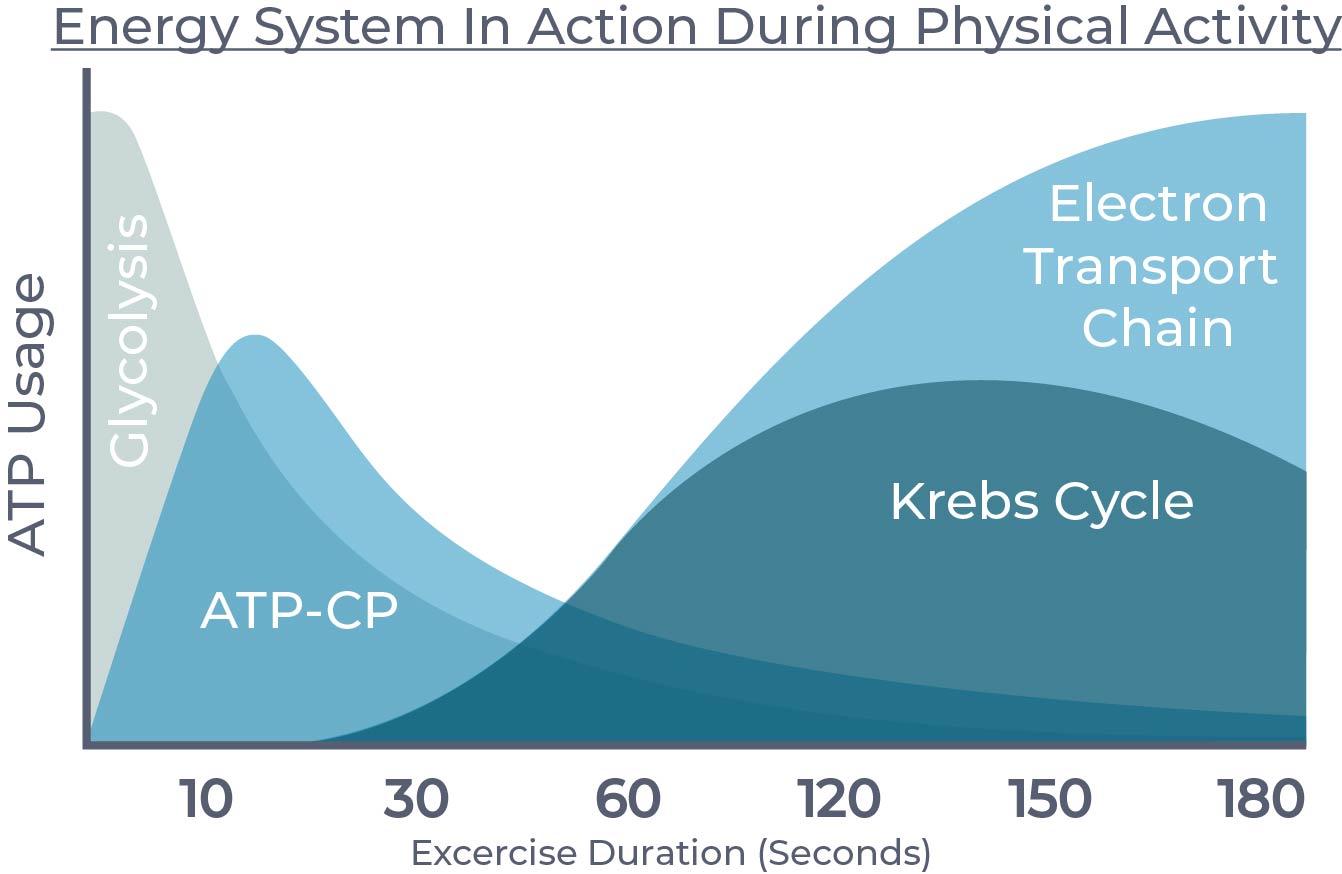
Energy System Contribution During Exercise Graph: OpenAI. (2025). ChatGPT. [Large language model]. https://chat.openai.com/chat Prompt: “I need a graph type image that shows what energy systems are prodomiently active during exercise duration over time. I need it to include the ATP-CP pathway, glycolysis, the Krebs cycle and the Electron transport chain.”
