51 6.4 Results of Atorvastatin Treatment for CKD Patients
Learning Objectives
Here you will see the results of Kimora et al.’s (2017) paper:
- Changes of lipid levels (both LDL and triglyceride levels) within the 2 groups
- Changes in eGFR and albumin excretion (measures of kidney function) within the 2 groups
Experimental Results of the Study by Kimura et al. (2017)
FOR ALL GRAPHS PRESENTED
* represents the value on the graph that is significant when compared to the original baseline value
# represents that the significant values between group A and group C when compared with each other
(Kimura et al., 2017)
To examine the effects of atorvastatin in patients within Kimura et al.’s (2017) study, different measurements were analyzed, including serum LDL cholesterol (mg/dl), serum triglycerides (mg/dl), eGFR levels (ml/min/1.73m²), and urinary albumin excretion (mg/g Cr). Measurements of serum LDL cholesterol and serum triglycerides show changes in dyslipidemia severity, and the measurements of eGFR and urinary albumin excretion show changes of kidney function.
In group A, the mean ages of the participants were about 63.2 years old, while the participants in group C have a mean age of 63.1 years old (Kimura et al., 2017). Because the participants in this study are part of the older population, some of the participants also had other medical conditions such as hypertension and diabetes (Kimura et al., 2017).
Lipid level changes:
Figure 1 shows the changes of serum LDL cholesterol (LDL-C). Normally in an healthy adult individual, LDL-C should be 100mg/dl or below (“Cholesterol levels by age,” n.d.). The target value of LDL-C for this study was 100mg/dl (Kimura et al., 2017). We can see from figure 1 that there was an extremely big drop in LDL-C levels during the first month in group A (dropped below the target level) (Kimura et al., 2017). While the control group lowered LDL-C in a slow and steady manner; however, the control group did not reach the target level set for the study (Kimura et al., 2017).
The baseline levels of serum LDL-C for group A (solid line) was 142.2mg/dl, and the levels for serum LDL-C for group C (dash line) was 145.9mg/dl (Kimura et al., 2017).
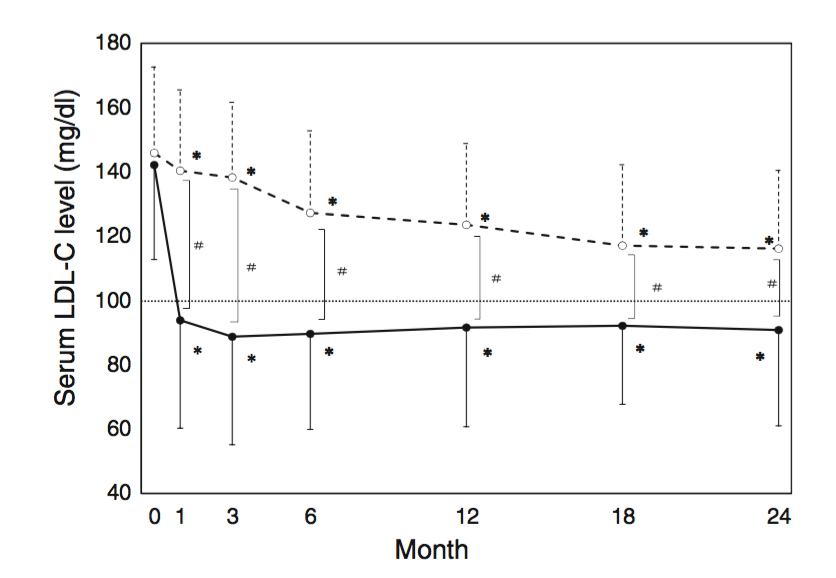
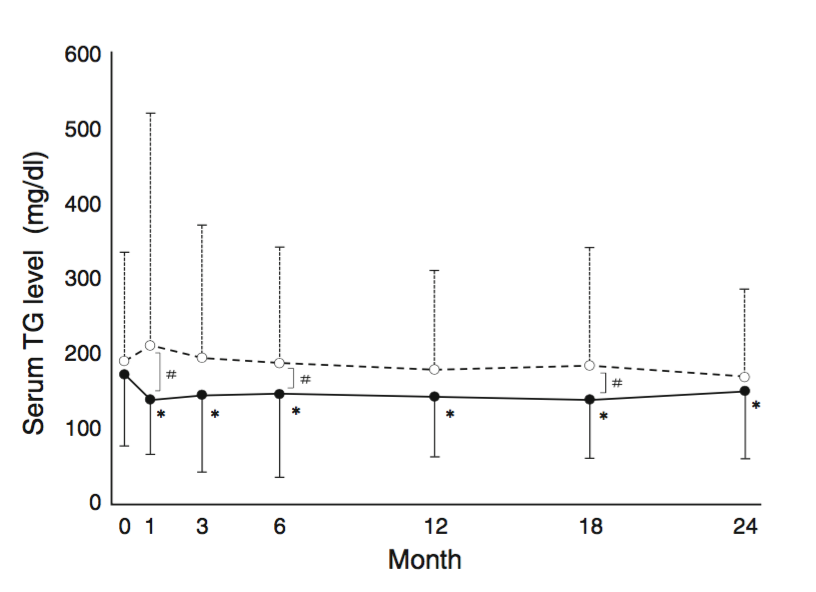
Figure 2 shows changes in serum triglyceride level throughout 24 months of Kimura et al.’s (2017) study. The baseline triglyceride levels are 172.1 mg/dl for group A and 189.9 mg/dl for group C (Kimura et al., 2017). Values ranging from 150-200 mg/dl are considered borderline (high) values (“Triglyceride Levels,” n.d.). Figure 2 shows us that group A (solid line) had significant changes in triglyceride levels compared to baseline from month 1 to month 24; however, in group C (dash line) it shows no significant changes compared to its baseline values (Kimura et al., 2017).
Changes in kidney function:
Changes in kidney function is measured by eGFR and urinary albumin excretion levels in the Kimura et al. (2017) study.
Figure 3 shows that after the 3rd month eGFR started to decrease in both groups. Group A started with an eGFR baseline value of 56.0 ml/min/1.73m2 and group C started with a value of 54.0 ml/min/1.73m2 (Kimura et al., 2017). When the eGFR changes are compared to its own baseline value, group A (solid line) had shown a significant drop in month 24, while a significant drop in value is seen starting at month 12 for group C (dash line) (Kimura et al., 2017). However, when the data was compared between the 2 groups, they could not conclude any significant differences (Kimura et al., 2017).
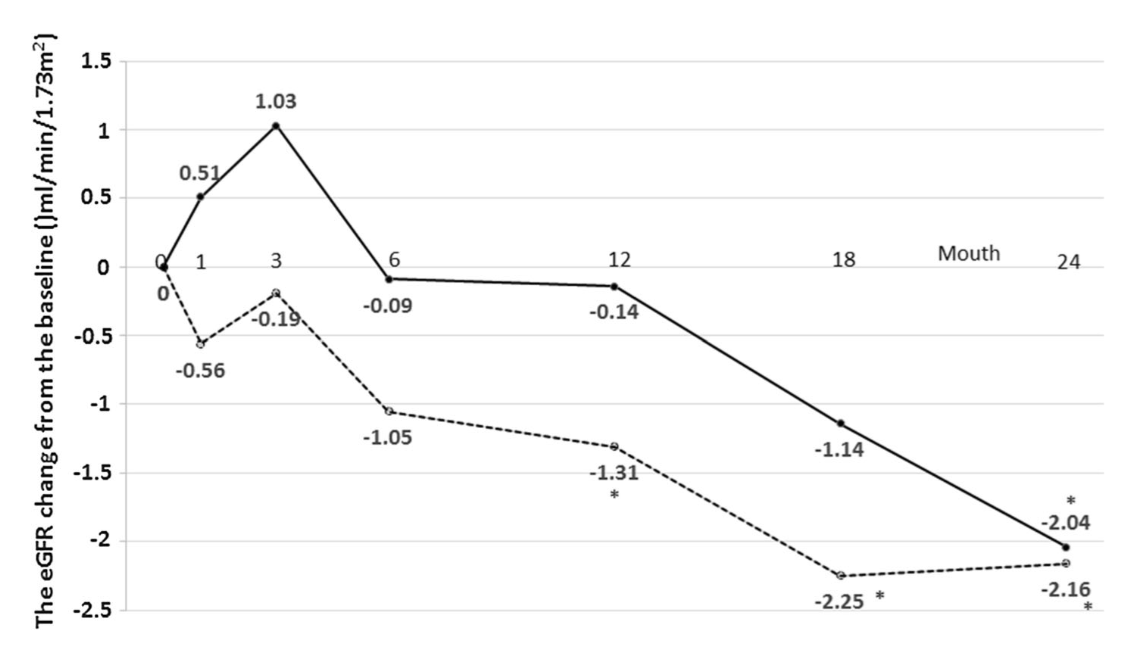
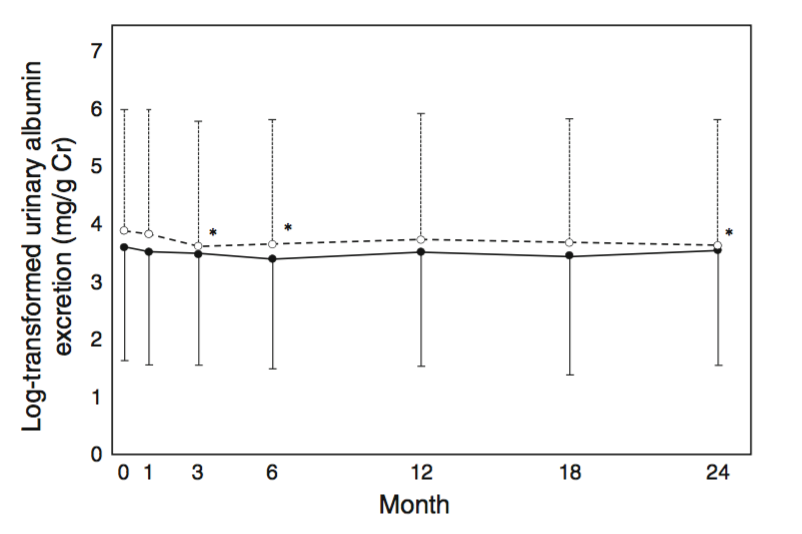
Figure 4 shows changes in urinary albumin excretion (log-transformed). Normally our blood contains the protein albumin and it should not be excreted in the urine, even if it is in the urine, the concentration should not be over 30mg/g (“Albuminuria,” 2015). The baseline value of group A is 248.1 mg/g (log-transformed value: 3.60 mg/g) and the baseline value of group C was 373.4 mg/g (log-transformed value: 3.89 mg/g) (Kimura et al., 2017). These values are higher than the normal value, indicating that the participants had a decline in kidney function before the study started. From figure 4, we can see that within the 24 months of Kimura et al.’s (2017) study, group A (solid line) had not shown any significant changes; however, there were changes detected in group C (dash line) at months 3,6 and 24.
Key Takeaways
Main results:
- The group treated with atorvastatin (Group A) had a lower amount of serum LDL-C after 24 months of treatment.
- Comparing to its own baseline, only group A’s reduction in serum triglyceride was significant
- Comparing to its own baseline, significant decrease in eGFR values was first detected in Group C
- Comparing to its own baseline, significance changes in urinary albumin excretion was only seen in Group C in the months 3,6, and 24.
Test Your Knowledge!