23 3.5 Diet-Associated Modifications of the Microbiota
General Overlook
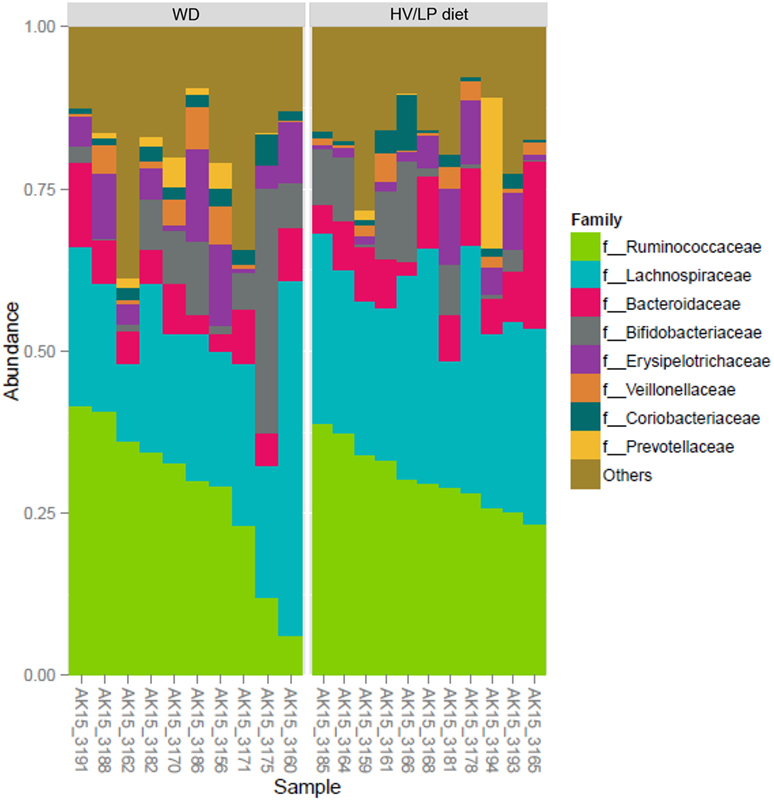
Following adherence to either the HV/LP diet or the WD for one year, microbiota analysis was performed on all of the individuals enrolled in the study. Overall, microbial taxonomy was similar between the two groups. In both diets, Firmicutes were the most abundant phylum (~75%), followed by Bacteroidetes (~15%) and Actinobacteria (~10%) (Figure 6). When looking more specifically at the family level, Ruminococcaceae (~30%) and Lachnospiraceae (~27%) were the most abundant families in both groups (Figure 7).


Specific Diet-Associated Modifications
Moreover, no significant difference in alpha diversity between the two groups was observed. There were no differences in the number of species in the microbial ecosystem (OTU count) or microbial distribution (Shannon index). When the authors of this paper investigated the abundance of individual species, significant differences were identified. In patients following the WD, the phylum Euryarchaeota was significantly more abundant compared to those following the HV/LP diet (p = 0.03). On the other hand, the bacteria Lachnospiraceae was significantly more abundant in participants following the HV/LP diet (p = 0.03).
Lachnospiraceae & Anti-Inflammatory Immune Cells
Lachnospiraceae bacteria has recently been described as a butyrate-producing microbe with anti-inflammatory properties (Tremlett et al., 2015). It has been found to facilitate Treg differentiation, as well as stimulate the production of anti-inflammatory cytokines, such as TGFβ and IL-10. As a result, the authors of this paper analyzed the correlation between Lachnospiraceae and immune parameters to investigate if it was associated with the preferential generation of an anti-inflammatory milieu. In line with this hypothesis, they discovered that Lachnospiraceae was significantly positively correlated with three anti-inflammatory immune cells; IL-10-producing CD14+ monocytes (p= 0.008), TGFβ-producing CD14+ monocytes (p= 0.01), and CD4+/CD5+/FoxP3+ Treg lymphocytes (p = 0.02).
Alpha diversity is the mean species diversity in a specific area. There are two measures of alpha diversity; OTU count (species richness) and shannon index (species diversity).
Treg cells are regulatory T cells that suppress the immune response, thereby preventing autoimmune disease.
