8 1.2 Cell Apoptosis and Viability
Brief Overview
One of the first experiments that Liu et al. conducted involved the use of an MTT assay. MTT assay is a colorimetric assay that is commonly used to determine cell viability by measuring the amount of cellular metabolic activity.
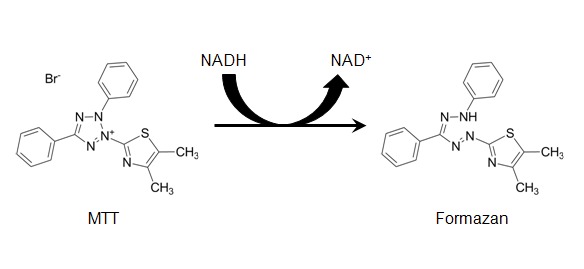
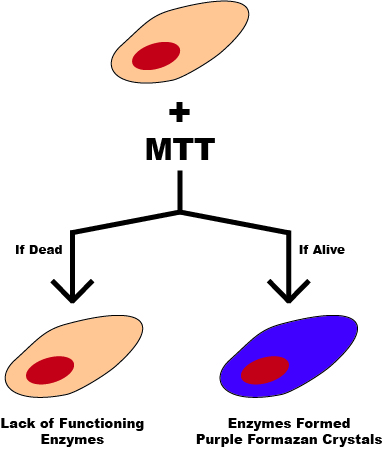
The reduction of MTT, which is 3-(4,5)-dimethylthiazol-2-yl)-2,5-diphenyltetrazolium bromide, by mitochondrial succinate dehydrogenase occurs when it enters the cell and passes into the mitochondria. When a cell is viable, it is likely to contain NADH- and NADPH-dependent enzymes that react with MTT. This causes MTT to be reduced into an insoluble, dark purple-coloured formazan product. Since the reduction of MTT can only occur in metabolically active cells, the level of activity is a measure of the viability of the cells. DMSO is added the cells because it is an excellent solvent for dissolving formazan crystals.
The intensity of the colour is normally measured using a spectrophotometer.[1]
Experiment Protocol
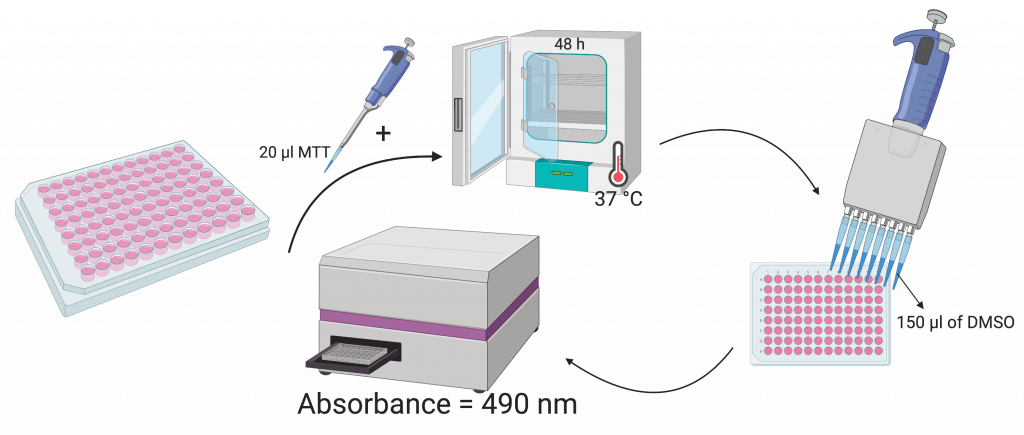
The second part of the experiment consisted of an MTT assay. The cells were mounted into 96 well plates with a density of 5 x 10³ cells. Following the initial treatment with the different doses of vitexin for 48 hours, 20 μM of MTT was added to each well, and the cells were incubated for 4 hours at 37 C. Next, 150 μM of DMSO which is a solvent used to dissolve Formazan crystals, was added to each well. With the aid of a microplate reader, the absorbance was measured at 490 nm.
Results
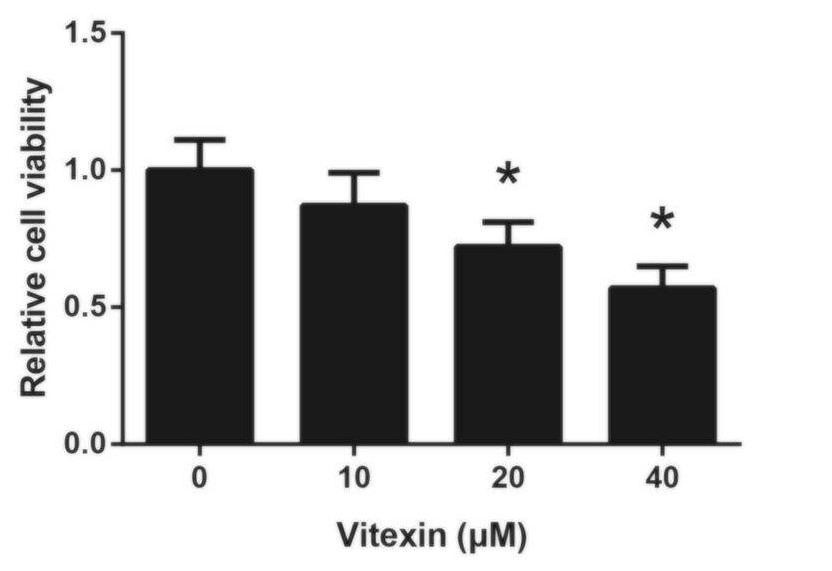
Using the MTT assay on A549 cells treated with varying concentrations of vitexin, the researchers were able to determine what effects vitexin can have on the cancer-derived cells.
Figure 4 outlines the results of their experiment. All results were compared relative to the amount of cell viability seen in the control cell population, which were not treated with vitexin. There is a noticeable decline in cell viability as the dosage of vitexin increases – this indicates a dose-dependent effect. However, only treatment with at least 20 μM of vitexin leads to a statistically significant decrease in cell viability in A549 cell populations.
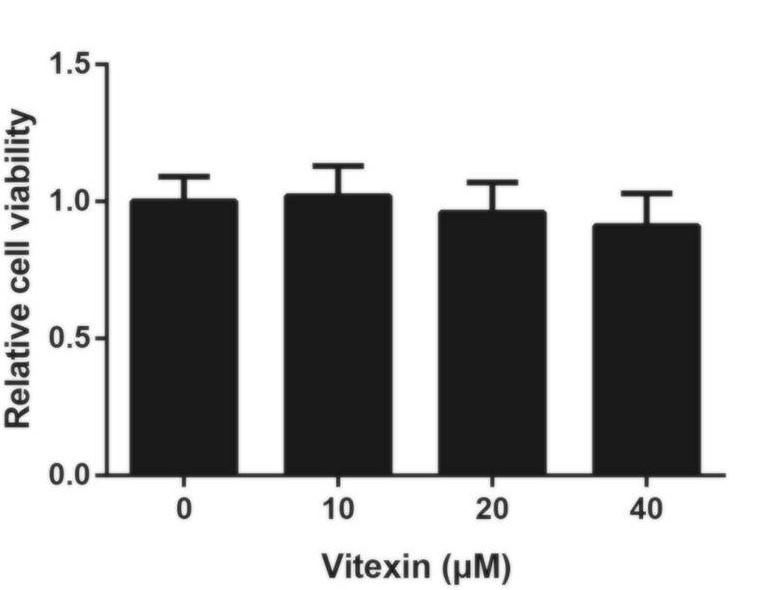
To determine if vitexin has any effect on cell viability in normal human cells, the researchers conducted the same experiment using 16HBE cells. 16HBE cells are normal human bronchial epithelial cells and are a commonly used model to determine the toxicity of substances.[2]
Unlike the results previously seen, Figure 5 clearly shows a lack of change in cell viability when 16HBE cells were treated with vitexin. At a quick glance, it may appear there is a slight decrease, however it’s important to note that the change is not statistically significant – statistically speaking, it is likely that the decrease is due to chance and not due to the vitexin. As a result, the researchers suggested that vitexin has no toxic effects on normal human bronchial cells.
Exercise: Critical Thinking
Due to the results outlined in Figure 3, Liu et al. (2019) concluded that vitexin had no toxic effects in normal human cells. Because of this, the researchers did not conduct any additional experiments with 16HBE cells.
- As the results suggest there is no statistical significance, would it be correct in saying that vitexin has no toxic effects on normal human cells? Why or why not?
- What changes would you have made to the experiment to determine if vitexin has toxic effects on human cells?
Answers at the end of the chapter.
Brief Overview
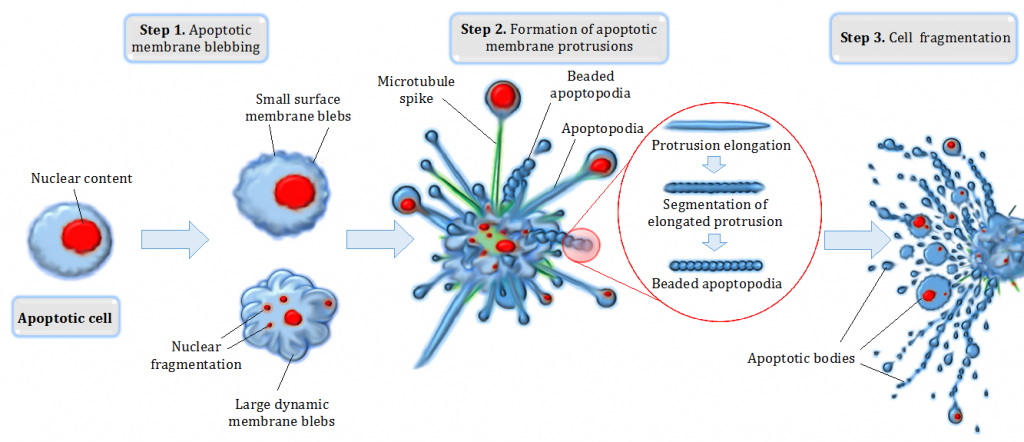
Cell apoptosis is programmed cell death, which can occur for numerous reasons within a cell. This is a growth-limiting regulatory mechanism in which cells can trigger their death in response to environmental signals. Many signals can cause this signalling to occur, and the most common are irreparable cellular or DNA damage.
An LDH assay is a great and straightforward way of determining the amount of cell damage there is going on in the cell culture. Lactate dehydrogenase (LDH) is a crucial enzyme found in cells, as it catalyzes important reactions involved in cellular metabolism. During cellular injury, as cellular membranes are weakened and damaged, LDH found in the cellular cytoplasm is released into the surrounding area.
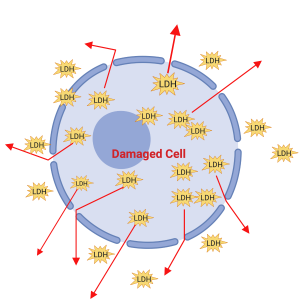
The basic principle of an LDH assay is that it converts lactate to pyruvate generating NADH from NAD. The absorbance measured by a microplate measures the interaction between the probe and the NADH to get an absorbance value. The amount of product formed is directly related to the LDH activity, which goes on in the cell. The amount of LDH released in the surrounding environment gets converted by enzymatic activity from iodonitrotetrazolium (INT) into red formazan crystals. When LDH is present in the cell culture, it reduces NAD+ to NADH and H+ through the oxidation of lactate to pyruvate. Afterward, the catalyst then transfers the hydrogen from the NADH+ compound to the iodonitrotetrazolium, and the red coloured formazan salt is formed. A microplate reader or standard spectroscopy measures the absorbance of how much formazan is formed by iodonitrotetrazolium. The colour of the formazan solution formed is proportional to the number of damaged cells in the culture (darker the solution means that there are more damaged cells compared to a lighter solution.)
Experiment Protocol
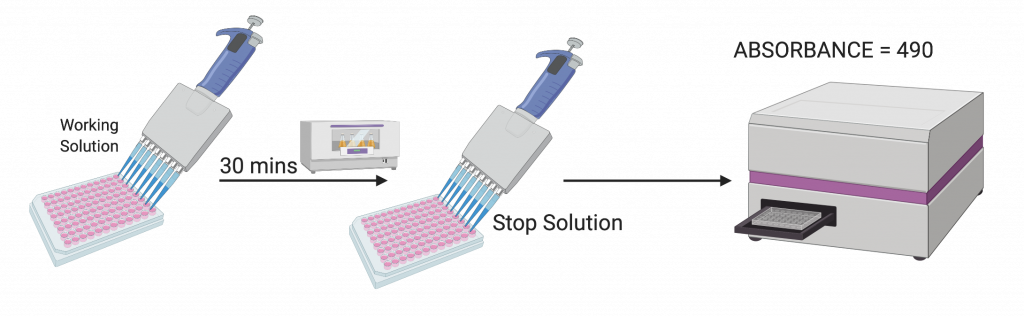
Following the initial treatment with the different doses of vitexin for 48 hours, and an LDH assay was performed using an LDH assay kit. The LDH assay kit helps measure if there LDH leakage into the culture medium to see if there is cell injury. They added 100 μM of working solution to each cell well, and for 30 minutes, the plates were incubated. Following the incubation, 50 μM of stop solution was added to each well. Like with the MTT assay, a microplate reader was used to measure the absorbance of the samples which were detected at 490 nm.
Results
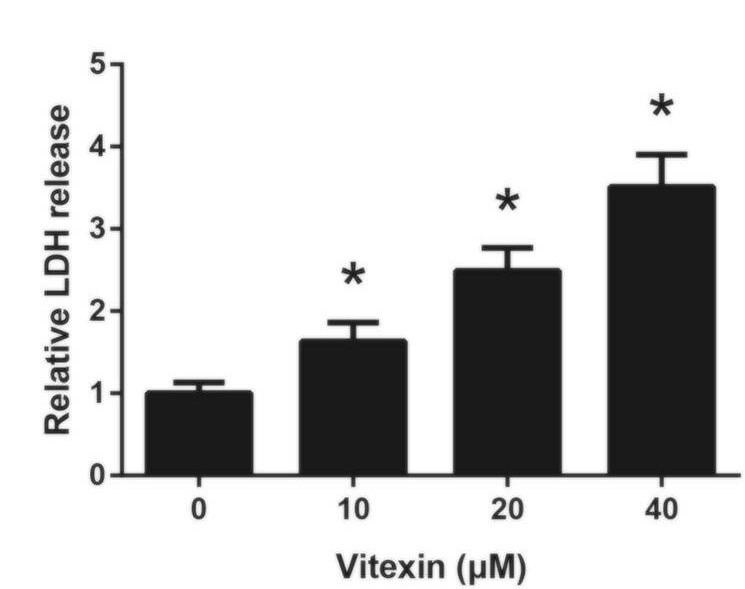
Figure 9 shows the results of a LDH release assay experiment done on A549 cells treated with vitexin. Compared to levels of LDH released in cells lacking vitexin treatment, the cells treated with 10 μM or more of vitexin showed significantly higher levels of LDH release. The levels of LDH release were substantial, nearly reaching four times the untreated amount when the cells were treated with 40 μM of vitexin. These results suggest that the reduction in A549 cell viability caused by vitexin is due to cellular injury, also induced by vitexin in a dose-dependent manner.
Experiment Protocol
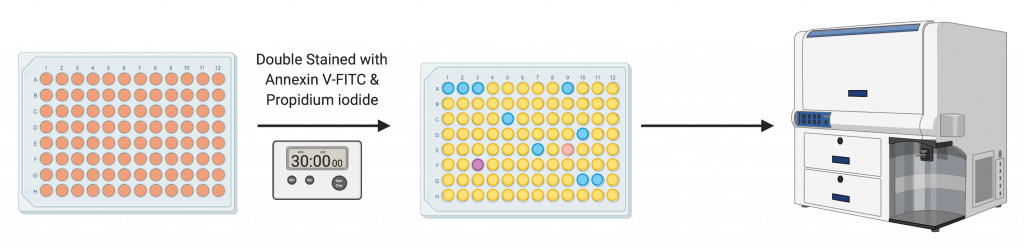
Following the initial treatment with the different doses of vitexin for 48 hours, an annexin apoptosis detection kit was used. The cells were harvested after 48 hours of treatment with trypsinization and double-stained with two solutions. The two solutions used were Annexin V and propidium iodide for 30 minutes. A FACSCaliber flow cytometer was used for analyzing the samples.
Experiment Overview
After determining that vitexin reduces viability of A549 cells, researchers wanted to determine whether or not this was due to apoptosis of the cells. To do so, Liu et al. (2019) utilized flow cytometry, a powerful technique that can measure and detect cell characteristics.
In a flow cytometer, the instrument used to conduct flow cytometry, a sample of cells is put through tube-like space large enough for only a single cell. Light from a light source strikes each individual cell as it passes through the tube. The light will scatter differently, depending on the characteristics of the cell. The scattered light provides data, which can be used to measure these characteristics.
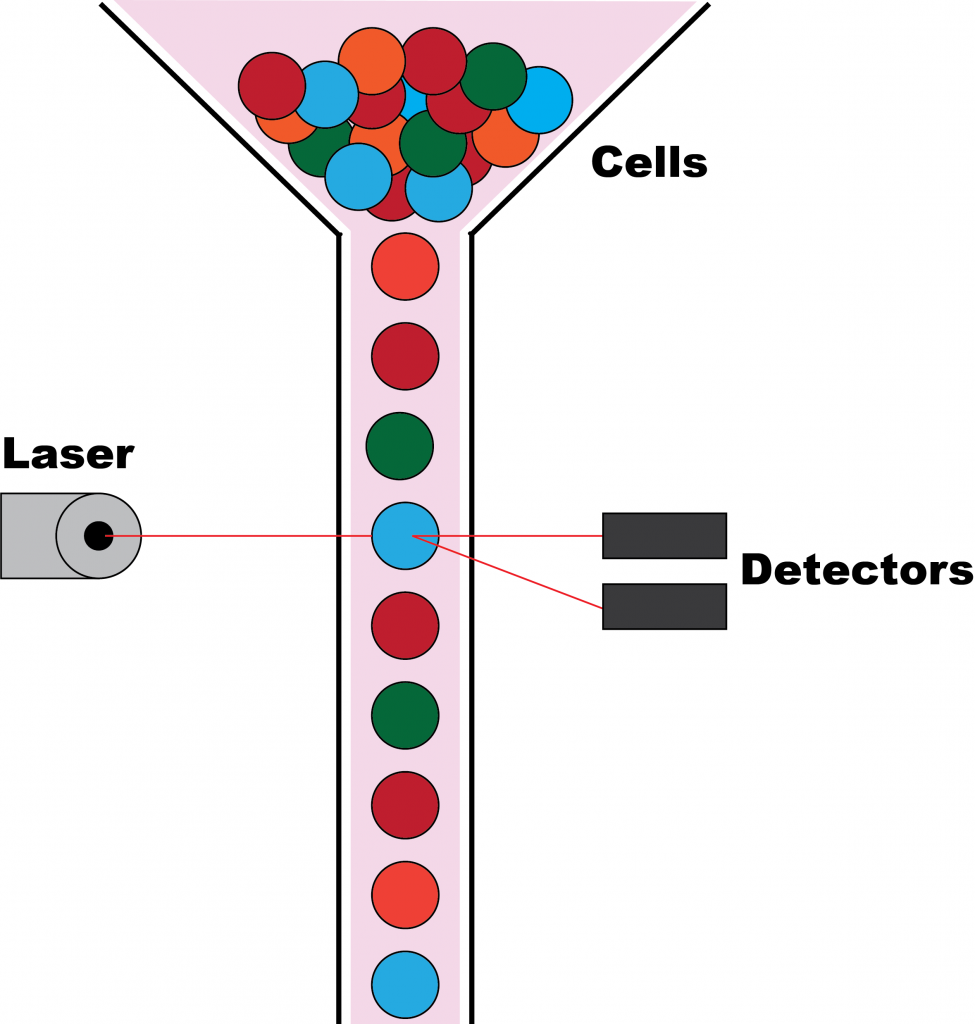
When flow cytometry was first developed, the instrument could only detect the size of cells. Today, there has been numerous technological improvements to the technique, which some flow cytometers being able to detect up to 14 different characteristics of cells. The flow cytometer used in this experiment measured the presence of two stains that A549 cells were treated with.[3]
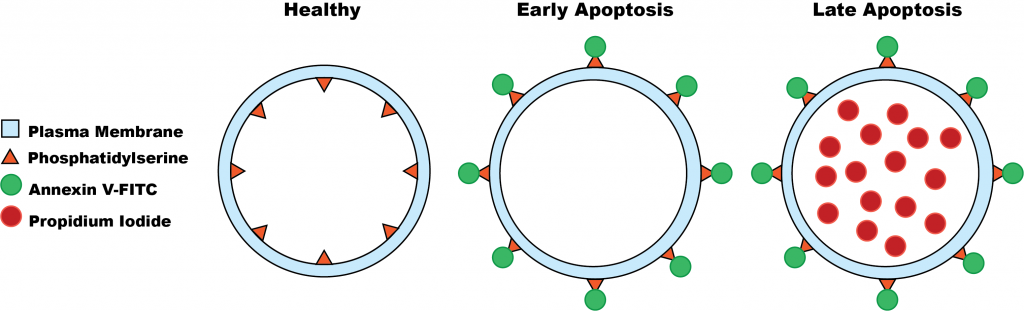
When cells undergo apoptosis, several changes to their morphology occurs; DNA is cleaved, the nucleus condenses, and most notably, the cell membrane loses its asymmetry. In a healthy cell, it’s normal for the inner and outer cell membrane to be composed of different lipids and proteins. However, one of the earliest features of apoptosis is the loss of this asymmetry. Phosphatidylserine, a phospholipid normally found in the inner membrane, is moved to the outer membrane, exposing it to the extracellular environment.
Annexin V, a phospholipid-binding protein, binds to the outer membrane phosphatidylserine found in cells undergoing apoptosis. Annexin V can be bound to fluorescein isothiocyanate (FITC) without any changes to its affinity to phosphatidylserine. The resulting Annexin V-FITC compound can be detected by flow cytometry as it can now fluoresce a green colour.
An additional stain called propidium iodide (PI) was also added. As the translocation of phosphatidylserine is an early feature of apoptosis, there needs to be a means of differentiating cells undergoing early apoptosis and cells undergoing late apoptosis. During early apoptosis, propidium iodide is excluded by the cell membrane, as it is still intact. As apoptosis progresses, propidium iodide is no longer excluded from and it is able to enter the cell cytoplasm. Propidium iodide gives off a fluorescent red colour.[4]
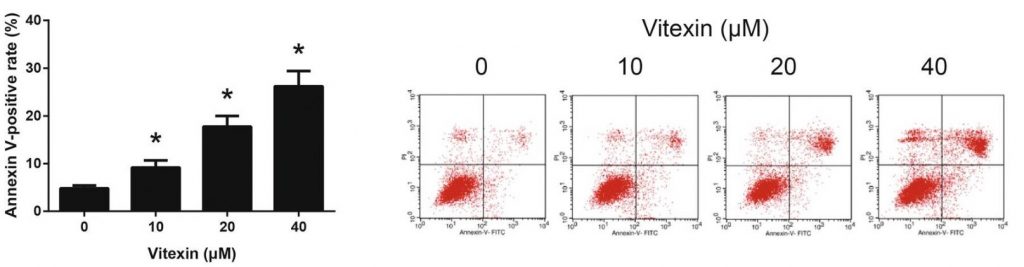
Using the two stains, Annexin-V and propidium iodide, researchers were able to detect whether A549 cells treated with vitexin were undergoing early apoptosis (Annexin V-FITC positive/PI negative), late apoptosis (Annexin V-FITC positive/PI positive), or were healthy (Annexin V-FITC negative/PI negative).
Results
Figure 13 shows the results of the flow cytometry experiment. Even the lowest dose of vitexin provided, 10 μM, led to a statistically significant increase in apoptosis of A549 cells. The results also suggest a dose-dependent effect; as the dosage of vitexin increases, so does the amount of annexin V-positive apoptosis.
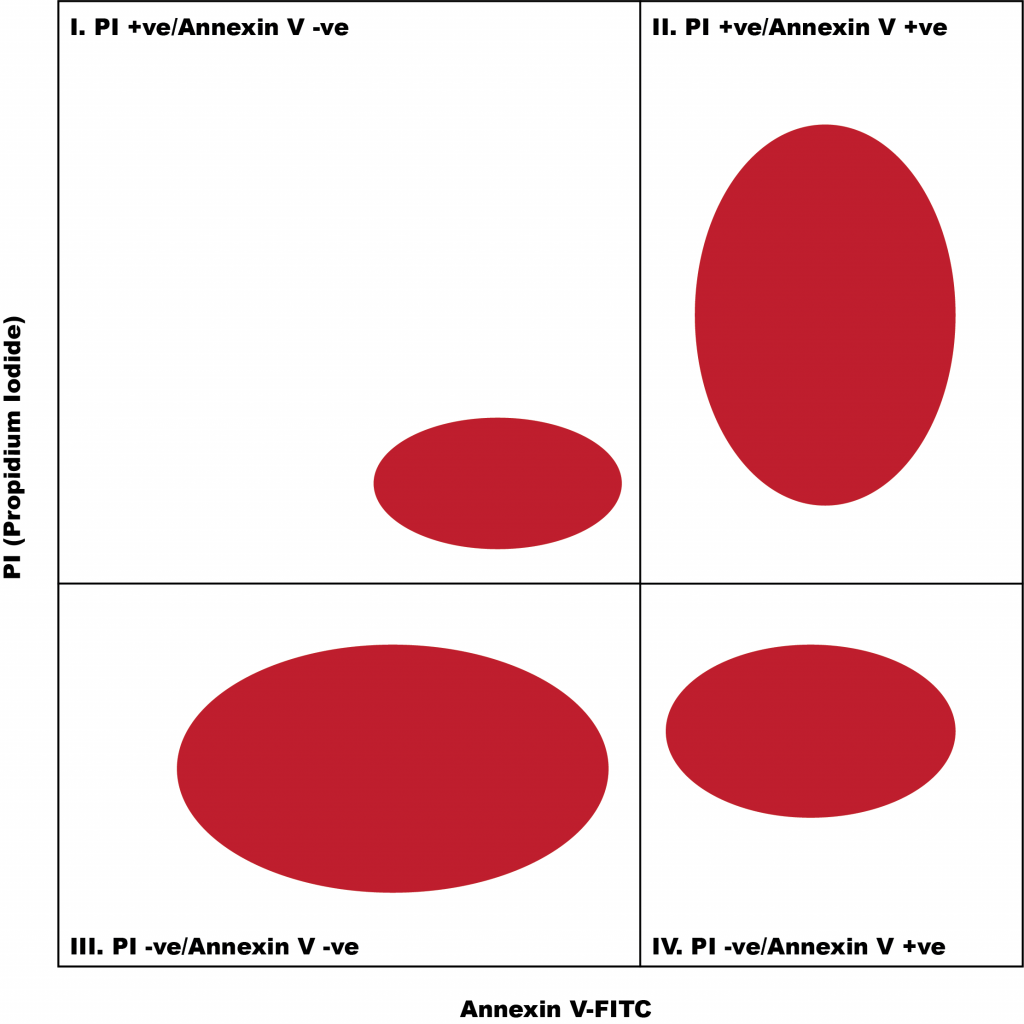
Sidebar: How to Analyze Flow Cytometry Density Plot
Below is a basic flow cytometry density plot. A density plot shows two measured characteristics, plotted on the two axes. Typically, a density plot will consist of many dots, each of which represent a single cell. Each dot can fall within four different “quadrants” of the plot, based on the levels of the cell’s measured characteristics.
Summary
Researchers conducted the following experiments to determine what effects vitexin has on the viability of A549 cells:
- An MTT assay determined that vitexin reduced A549 cell viability in a dose-dependent manner.
- A LDH release assay determined that vitexin treatment on A549 cells led to increased cellular injury in a dose-dependent manner, as observed by an increase in LDH release.
- Flow cytometry analysis for annexin V-positive cells showed that vitexin causes apoptosis in A549 cells.
The researchers also conducted an MTT assay for 16HBE cells treated with vitexin and found no significant changes to cell viability; vitexin has no toxic effects on normal human bronchial cells.
Exercise Answers:
You should have made the following considerations, although many answers are possible for these open-ended questions:
- Although there is no statistically significant difference when normal cells were treated with vitexin, it does not mean that vitexin has no toxic effects on normal cells. Further research needs to be done with the following considerations
- Higher dosages
- Long-term effects
- Other, non-bronchial, cell types
- You can increase the dosage, increase the amount of time exposed to vitexin, and repeat the experiment with other cell types.
- Riss TL, Moravec RA, Niles AL, Duellman S, Benink HA, Worzella TJ, Minor L. 2004. Cell Viability Assays. In: Sittampalam GS, Grossman A, Brimacombe K, Arkin M, Auld D, Austin CP, Baell J, Bejcek B, Caaveiro JMM, Chung TDY, et al., editors. Assay Guidance Manual. Bethesda (MD): Eli Lilly & Company and the National Center for Advancing Translational Sciences. [accessed 2019 Nov 24]. http://www.ncbi.nlm.nih.gov/books/NBK144065/. ↵
- Feng W, Guo J, Huang H, Xia B, Liu H, Li J, Lin S, Li T, Liu J, Li H. 2015. Human Normal Bronchial Epithelial Cells: A Novel In Vitro Cell Model for Toxicity Evaluation. PLoS One. 10(4). doi:10.1371/journal.pone.0123520. [accessed 2019 Nov 24]. https://www.ncbi.nlm.nih.gov/pmc/articles/PMC4393029/. ↵
- Adan A, Alizada G, Kiraz Y, Baran Y, Nalbant A. 2017. Flow cytometry: basic principles and applications. Critical Reviews in Biotechnology. 37(2):163–176. doi:10.3109/07388551.2015.1128876. ↵
- Wlodkowic D, Skommer J, Darzynkiewicz Z. 2009. Flow cytometry-based apoptosis detection. Methods Mol Biol. 559. doi:10.1007/978-1-60327-017-5_2. [accessed 2019 Nov 24]. https://www.ncbi.nlm.nih.gov/pmc/articles/PMC3863590/. ↵
A test used to analyze the presence, absence, or quantity of one or more components in a sample. Definition adapted from Merriam-Webster.
Refers to the proportion of live & healthy cells in a cell population.
An instrument used to measure the intensity of light at a certain wavelength. It functions by analyzing the amount of light absorbed by the sample.
Suggests that the amount of a treatment is related to the effects of the treatment. Increasing or decreasing the amount of a treatment will lead to outcomes that are different from the other.
Micromolar - a measure of concentration
If something is statistically significant, it suggests that the relationship being observed is not likely to be due to chance.
Programmed and controlled cell death.