7.4.2 – In-vitro Analysis of NAP and Neurotoxicity
Article:
Reduction of aluminum ion neurotoxicity through a small peptide application – NAP treatment of Alzheimer’s disease
PURPOSE
A paper published in 2018 by Yang et. al. wanted to identify protein bio-markers that were associated with aluminum ion toxicity and understand the neuroprotective activity of NAP treatment in-vitro. Aluminum toxicity was specifically used because it demonstrated Alzheimer’s disease-like toxicity.
METHODS
SH-SY5Y neuroblastoma cells were used for the in vitro experiments, since they were ideal candidates for studying aluminum and NAP activities in a neuronal model system.The cells were cultured for 24 hours in Aluminum Chloride and NAP in medium to allow cell shape changes to occur. The amount of NAP added was not specified but the concentration of aluminum ions ranged from 0 to 1000 micromolars to determine dose dependency.
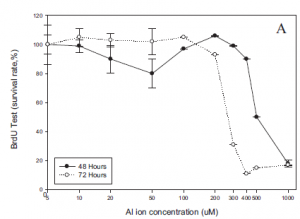
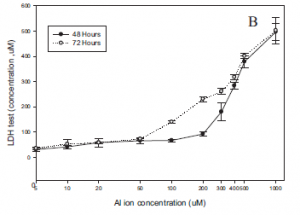
Their initial set of experiments were designed to look at cell proliferation and cell viability with and without aluminum ions. BrdU assays were performed to determine cell proliferation, while LDH assays were done to determine cell cytotoxicity. DPPH was also used to determine the antioxidant activity of aluminum. This helped quantify the stress response of the neuroblastoma cells upon treatment with aluminum ions.
The next portion of their experiments were designed to understand the effects of aluminum ions and NAP at the protein level. ELISA assays were used to detect and quantify the concentrations of amyloid precursor protein, beta-amyloid, Tau, and ADNP and these quantities were then compared between control, aluminum, and aluminum+NAP treatment groups. Additionally, mass spectrometry coupled with the use of the Swiss-Prot and UniProt human protein sequence databases was used to identify proteins that were upregulated upon aluminum treatment. Western blotting was also used to visualize expression patterns across the various treatment groups. Finally, protein – protein interactions were mapped using computer software to identify potential pathways that would be impacted by treatment
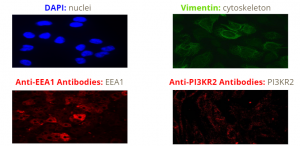
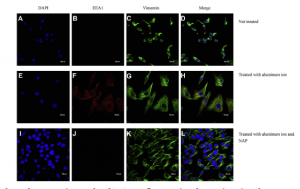
Following the identification of proteins of interest, DAPI (blue), Vimentin (green), and antibody (red) staining was used to image various components within the cells. The antibodies were used specifically to study the expression and cellular localization of two candidate proteins that were induced by aluminum and reduced by NAP.
Cellular Response to Aluminum and NAP Treatment
Based on the results of the BrdU assay, it was observed that aluminum ion concentrations over 400µM led to a steep decline in cell proliferation for SH-SY5Y cells (Fig.6). Prior to that, cell proliferation levels appeared relatively stable. Additionally the results of the LDH assay showed that increasing cellular aluminum ion concentrations over 100µM, led to increased cellular cytotoxicity (Fig.6).
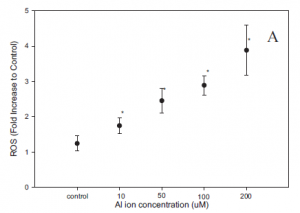
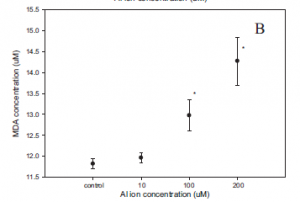
When analyzing cellular stress response, researchers measured levels for both reactive oxygen species (ROS) and an end product of oxidative stress: MDA (Fig.7). Both increased in a seemingly linear manner, indicating a dose dependent effect based on the amount of aluminum ions present (Fig.7). This meant that the magnitude of the stress response increased with an increasing concentration of aluminum ions.
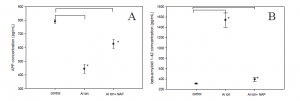
Amyloid Precursor Protein (APP) and Amyloid beta 1-42 (Aβ1-42) concentrations were measured across three treatment groups. Under the control conditions they found higher levels of APP and lower levels of Aβ1-42, which would be expected in healthy cells (Fig.8). Upon treatment with aluminum ions, they found a decrease in APP and an increase in Aβ1-42 relative to the control. Finally, when cells were treated with aluminum ions and NAP, they found that there was a decrease in APP concentrations, but there was not much of an increase in Aβ1-42 levels relative to the control (Fig 8). It is important to note that this effect was only observed in Aβ1-42 and not in any of the other beta amyloids that they assessed, such as Aβ1-40. These results highlighted how NAP specifically prevented APP from being cleaved into Aβ1-42, however since APP levels in the NAP treatment group were roughly halved compared to the control, it meant that APP was still being cleaved into other variants of Aβ.
Proteins of Interest and Morphology
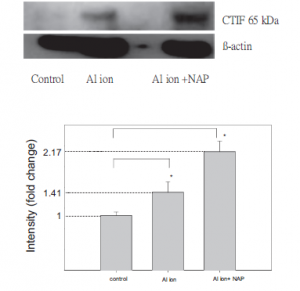
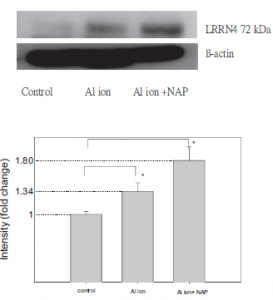
Through protein sequence analyses, Western blotting and protein assays, the researchers were able to narrow down four proteins of interest which showed increased expression levels upon treatment with aluminum ions in the neuroblastoma cells. The four proteins of interest included: EEA1 P13KR2, CTIF,LRRN4. They used the results of their Western blot experiment to depict expression levels of only CTIF and LRRN4 across the three treatment situations (control, aluminum, aluminum+ NAP) (Fig.9). However, these proteins did not show decreased intensity upon treatment with NAP (Fig.9). EEA1 and P13KR2 were the only proteins which decreased in intensity upon treatment with NAP.
Functionally, EEA1 is a membrane bound protein which is involved in endosomal trafficking and amyloidogenesis. PI3KR2 is a PI3P kinase regulatory subunit that is positively correlated with beta amyloid and activates signal cascades for cell growth and proliferation. Since these proteins were downregulated upon treatment with NAP, researchers decided to study them further based on morphological features. They found that cytosolic expression levels of the anti-EEA1 and anti-Pi3KR2 antibodies increased with aluminum treatment and decreased with NAP treatment as shown below in figure 10.
Mapped Interaction Pathway
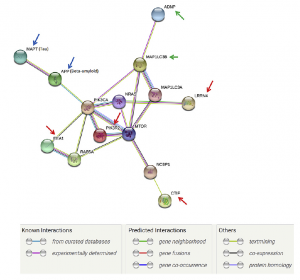
Using web-based software, protein-protein interactions were mapped. All mentioned proteins of interest were linked to the MTOR pathway, which is responsible for cell proliferation and cell survival. Other elements such as APP and ADNP were also shown to have effect on the MTOR pathway. Additionally, the green arrows indicated areas where NAP therapy could enhance to improve downstream effects along the MTOR pathway.
Mapped Protein Interaction Pathway
Critiques
While this paper presents NAP as a good remedy for aluminum-induced Alzheimer’s disease, there are a couple of key findings to keep in mind. While NAP did end up reducing beta-amyloid 1-42 levels compared to the aluminum-only treatment group, it also boosted beta amyloid 1-40 and 1-X levels, a very bad outcome considering the tight relationship between beta amyloid and Alzheimer’s disease. This suggests that while it can actually have some positive effects, it may also negatively affect it to a good degree. It is worth considering using another therapy in conjunction, as was mentioned in emerging treatment options, as they could not only reduce the other increased amyloids, but improve on other regions of Alzheimer’s disease as well.
Similarly, a very clear deficiency in the methodology is apparent by looking over the Western blot. In the control lane, the B-actin lane, there is a significant amount of bleedover from one lane to the other. While this issue is not as apparent in the lanes following it,the crooked line that the beta actin forms makes it much harder to determine how much of each lane is actually the component that they are trying to show, as there is a fairly significant vertical difference between the beta actin of the rightmost lane and the one in the middle, which could very easily lead to a different protein displaying in the lane if these were done in the same Western blot.