Appendix A: Nuclear Energy Is Our Best Alternative for Clean Affordable Energy by Emily Campchero
[These sample student papers are provided only as examples of successful student research: they are not meant to prescribe any standard paper format and the content of each paper represents purely the author’s view.]
“Our doubts are traitors, and make us lose the good we oft might win, by fearing to attempt”. —William Shakespeare
Nuclear Energy Is Our Best Alternative for Clean Affordable Energy
Though it may surprise many environmentalists, nuclear power is environmentally friendly, or “green.” Society needs clean, cost-effective energy for a number of reasons: global warming, economic development, pollution reduction, etc. There is a popular perception that this means moving toward solar, wind, and other forms of renewable energy. However, a more in-depth analysis reveals that those alternatives are not yet practical. For the foreseeable future, nuclear must remain one of the top producers of energy in the United States. In this paper, I will address several of the misconceptions that prevent people from appreciating the benefits of nuclear energy in the context of our current economy.
Nuclear Power Is Safe
One of the biggest obstacles with moving toward nuclear power is that people are afraid of it. Accidents and disasters scare people. News reports that sensationalize events, rather than explaining them, heighten anxieties.
Chernobyl
In 1986, there was a nuclear accident at the Chernobyl nuclear power plant in the Ukraine. This was the result of a flawed reactor design that was operated with inadequately trained personnel. It was a direct result of the Cold War isolation and the resulting lack of any safety culture. This caused a steam explosion and fire. There were thirty deaths over three months. No one offsite suffered from radiation exposure—all fatalities occurred with plant operators and firemen—but there was a large increase in childhood thyroid cancers, which is said to be attributed to the intake of radioactive iodine fallout. The Chernobyl accident is different from any other nuclear power plant accident because there were radiation-related fatalities. There were no signs of radiation exposure in the general public. The design of this nuclear reactor was extremely poor; the combination of the hot fuel with the cooling water led to fuel fragmentation along with rapid steam production and an increase in pressure, thereby destroying the reactor. This caused an explosion. This accident caused the largest uncontrolled radioactive release ever recorded for any civilian operation.
Three Mile Island
On March 28, 1979, the Three Mile Island nuclear power plant experienced a cooling malfunction that caused part of the core to melt in the number two reactor. This destroyed the reactor. Although some radioactive gas was released, there was not enough to cause local residents to experience any dose above background levels. There were no injuries or adverse health effects from the Three Mile Island accident. Despite no fatalities or injuries, no new nuclear power plants have been built in the United States since 1979 because of the problem at Three Mile Island. The Three Mile Island accident was the most serious in US commercial nuclear power plant history; this is because it brought on huge changes in the emergency response planning, nuclear operator training, human factors engineering, radiation protection, and many other areas of nuclear power plant operations. This accident also made the United States Nuclear Regulatory Commission to tighten and heighten its regulatory oversight. Also, it changed the standards that nuclear power plants must meet, set by the Institute for Nuclear Power Operations. Training, operations, and event reporting rules become extremely strict and essential. Overall, this accident had a massive effect on enhancing the safety of nuclear plants.
Fukushima
More recently, the Fukushima disaster in Japan on March 3, 2011, has affected peoples’ views on nuclear energy. There was an offshore earthquake. In addition to the tremors, a fifty-foot tsunami was created. The tsunami hit the Fukushima nuclear power plant (in addition to other parts of Japan), disabling the power supply and the cooling of three reactors. All three cores melted within three days. The power plant was not designed to withstand that severe a tsunami, which caused severe problems at the power plant. After two weeks, the reactors were stable. The other prominent issue with this accident was preventing the release of radioactive materials. There have been no deaths or cases of radiation sickness. There were two fatalities on the day of the tsunami, on site, and while tragic, it was due to the tsunami, not the power plant; this represents few casualties compared to other energy disasters.
Long-Term Health Effects
The other main question about nuclear power is: What about the long-term health effects from radiation? The following is part of the conclusion from a report of a survey by researchers at the US National Cancer Institute.
If conventional estimates of the cancer risks attributable to radiation are accepted, exposures from the monitored emissions from nuclear facilities in the United States, typically less than 3 millirem per year, to the maximally exposed individual, were too small to result in detectable harm. Such levels are, in fact, much smaller than the population exposures from natural background radiation, which amount to about 100 millirem per year, excluding lung doses from radon (Jablon, Hrubec, and Boice 1991).
When looking at the highest and worst possible levels of radiation people could receive in Fukushima, 22 rem, 194 excess cancers would be created out of the 22,000 people. Clearly this is not a good thing, but you also need to remember that the 22 rem was the highest dose recorded before evacuation; and the largest amount of radiation came from iodine, which has a half-life of eight days (Muller 2012).
Nuclear Waste Disposal
Nuclear fuel, when it is depleted, must be replaced with new uranium. This occurs during a refueling outage. The depleted fuel rods still produce decay heat. The decay heat is removed by storing the fuel rods in cooling pools. When the residual decay heat is low enough, the fuel rods can be removed from the cooling pools and packaged for long-term storage. This long-term storage isolates the fuel rods from people and the environment, until the fuel decays and no longer poses a radiation hazard.
Nuclear waste disposal is already included in the cost of nuclear energy.
America’s Fear of Nuclear Energy
For years, American citizens have been so afraid of nuclear power. When America first discovered the possibilities, people were thrilled, until they began to link it with the A- bomb, and only with the A-bomb. For over fifty years, people have let its destructiveness eclipse its power for good. They have associated nuclear power with deaths of innocent people and the power to wipe out entire cities. What they do not realize is that nuclear energy can power an entire city and save the lives of innocent people. We have learned from the past, made leaps and bounds in our technology, and have an improved and extraordinary understanding of how nuclear power works. Now it is time for everyone in the United States of America to understand, believe, and support that.
Most films depict nuclear energy as a dangerous and volatile energy source. One of the most popular films this year, The Dark Knight Rises was no exception. The entire story revolved around a nuclear source of energy that could power the entire city of Gotham. The only problem was that, if this power were to get in the wrong hands, it would become a giant nuclear bomb, thereby destroying the city of Gotham. Almost annually, a film comes out about a fictional nuclear apocalypse. With all of this negative publicity, why would anyone support nuclear energy? For years, pop culture has been exploiting the idea of nuclear power and brainwashing people to be terrified of something they know nothing about. One of the main films that started this crisis was The China Syndrome, which came out in March 1979, only twelve days before the nuclear accident on Three Mile Island. The film’s distortion of nuclear power coupled with the Three Mile Island accident added to the hysteria about potential nuclear accidents. We need to create a new image in this country’s mind about how advantageous nuclear power can really be for us. If the media and films portrayed nuclear power in a realistic way, people would be educated about this energy source and begin to look at nuclear power as a solution to our energy crisis. We need to stop letting fictional popular media influence our opinions on nuclear power. It is time for America to know the truth.
Energy Sources
Electricity is an integral part of our daily lives. (It is taken for granted, until a hurricane disrupts it for a lengthy period.) Normally, various power plants generate electricity, which is transmitted and distributed to users, e.g., homes, schools, businesses, and factories. This paper discusses the problem of selecting the preferred energy source for growth in electrical generation.
So with a plethora of choices, how do we know which one is the best? Which will save us the most money? Which will save the earth? These are all serious questions that need to be answered when we are looking toward the future.
Hydroelectric Power
Hydro may be considered the first renewable energy source. That is why the prime hydropower sites have already been developed. Hydroelectric power, using the potential energy of rivers, now supplies 17.5 percent of the world’s electricity (99 percent in Norway, 57 percent in Canada, 55 percent in Switzerland, 40 percent in Sweden, and 7 percent in the United States). It is not a major option for the future in developed countries, because most potential major sites in these countries are either being exploited already or are unavailable for other reasons such as environmental considerations. Growth to 2030 is expected mostly in China and Latin America (“Hydroelectric Power” 2005).
Solar Power and Wind Power
Wind and solar are relatively new renewable energy sources.
Solar power usually is considered to be direct generation of electricity from sunlight. (Solar power is also used for heating, but that is not part of this discussion.)
Photovoltaic (PV) cells are the building blocks of all PV systems because they are the devices that convert sunlight to electricity. Commonly known as solar cells, individual PV cells are electricity-producing devices made of semiconductor materials. PV cells come in many sizes and shapes, from smaller than a postage stamp to several inches across. They are often connected together to form PV modules that may be up to several feet long and a few feet wide. Modules, in turn, can be combined and connected to form PV arrays of different sizes and power output. When light shines on a PV cell, it may be reflected, absorbed, or pass right through. But only the absorbed light generates electricity.
Wind energy technologies use the energy in wind for generating electricity. Most wind energy technologies can be used as stand-alone applications, connected to a utility power grid, or even combined with a photovoltaic system. For utility-scale sources of wind energy, a large number of turbines are usually built close together to form a wind farm that provides grid power (“Renewable Energy Technology Basics” 2012).
Both solar and wind energy are considered sustainable, meaning that they provide electricity without harming the environment. They are possible sources of providing electrical energy growth.
Although there are many positive aspects of solar and wind energy, there are also many disadvantages that need to be considered.
Subsidies and Cost
One disadvantage of solar power and wind power is their high cost. Even though there is no charge for sunshine or wind, neither solar nor wind energy is cost competitive. Some argue that these are new technologies that require investments, or subsidies, to foster their development. What people do not realize is that even by subsidizing these energy sources, they are still not cost competitive. The government is using taxpayer’s money to promote an energy source that is a financial failure. The United States is not the only country having to face the facts that these subsides do not make solar and wind energy cost competitive, as countries like Germany and China are learning this as well.
China dominates the solar panel market. The cost of generating solar power has dramatically decreased over the past few years, but it is still triple the price of coal- generated power in China. Even dominating the solar panel market does not compensate for an unprofitable power panel. The solar companies are losing money and going out of business. No matter how you spin it, there is no way to make alternative energy that is triple the cost a practical choice.
Germany, the country in the European Union with the most productive economy, has been switching from nuclear power to solar and wind energy; it has been far from successful. The German government, like others, has also been heavily subsidizing solar and wind energy. The subsidies do not compensate for the sunshine average in Germany being less than that in Chicago. Energy costs now represent the biggest liability for Germany as a place to do business, especially in light of the marked increase in the number of blackouts and voltage fluctuations in the grid.
Green for Whom?
Solar and wind energy are considered to be extremely beneficial to people and the environment. That may not be a universal viewpoint. The Mexican government continues to install wind farms in the narrow waist of Mexico, known as the Isthmus of Tehuantepec, where winds from the Pacific meet winds from the Gulf of Mexico. The people who live there do not always agree that the wind farms are either an economic benefit or an environmental benefit. The indigenous people are not receiving the jobs and revenues that they were promised. Farmers and fishermen view the wind farms as harming their environment. The fishermen noticed that the research for the wind farms resulted in a mass die-off of fish. The vibrations from the wind turbines are affecting the livestock and fish, and the blades are chopping up birds. What is “green” for Mexico as a whole is not necessarily “green” for local communities.
Safety
The process of manufacturing PV cells from silicon relies on silane, a dangerous pyrophoric gas. As manufacturers produce silicon solar cells, the use of silane continues. Of course, silane is hardly the only environmental hazard involved in solar cell production. Others include toxic by-products from polysilicon manufacture dumped indiscriminately in China, and recovering cadmium—a known human carcinogen that is a primary ingredient in some thin—film solar cells—from mining slimes. Still, only silane (SiH4) has been linked directly to any deaths as a result of the solar industry.
Keep in mind that some of the components of PV cells are toxic materials. When the cells are intact, the materials are encapsulated. However, if there is a fire, the toxic materials may pose a significant hazard to anyone in the area.
PV cells are installed on rooftops. This is elevated work, which has its safety concerns. A primary safety concern with wind turbines is their height as well. Installation and maintenance require elevated work. Note that many turbines are at elevations of 300 feet (100 meters). Obviously high winds and rotating machinery are not a safe combination. Figure 2 shows the fatalities associated with wind energy.
| Summary of Deaths in Wind Energy | |
| 20-Jul-12 | |
| Number of deaths in construction (installation or Removal) | 41 |
| Number of deaths in O&M | 18 |
| Number of deaths of the public | 8 |
| Number of deaths in manufacturing | 2 |
| Number of deaths in training | 6 |
| Suicides | 1 |
| Total | 76 |
| Copyright 2012 by Paul Gripe. All rights reserved. This data is provided as a public service. | |
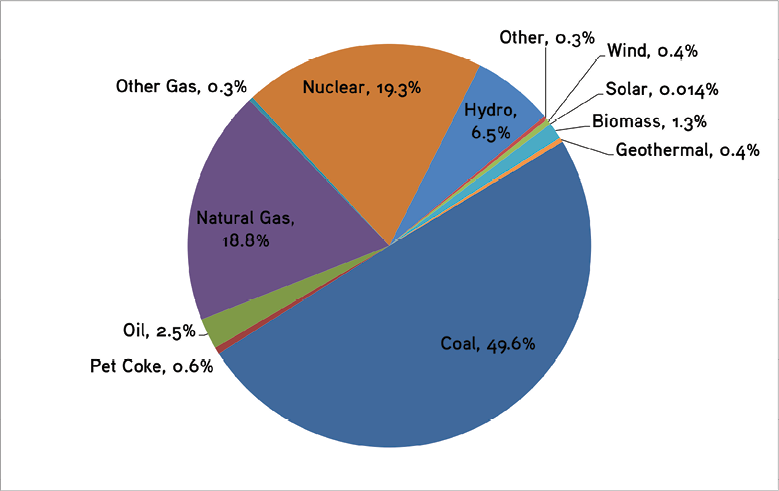
Solar energy accounts for 0.01percent of our nation’s energy. Wind energy accounts for 0.44 percent (see Figure 1). These energy sources are not likely to be significant in the near future. Solar and wind energy are not cost effective. As mentioned, they are not as environmentally friendly as considered by their proponents. There are also safety hazards that cannot be ignored. They provide a tiny fraction of needed energy, and only when the wind is blowing or the sun is shining brightly. They are possible energy sources for the long-term, but are only applicable for a few locations, at present.
Coal energy accounts for 50 percent, natural gas 19 percent, and nuclear power 19 percent, of our nation’s power (see to Figure 1). This focuses our energy source selection among coal, nuclear, and natural gas, as they are the largest sources.
Coal, Gas, and Nuclear
Generation Background
The main method of generating electricity is from heat. A source of heat is used to raise the temperature of water to turn it into steam, which transfers its energy to a turbine. The rotation of the turbine, which is physically connected to a generator, generates electricity.
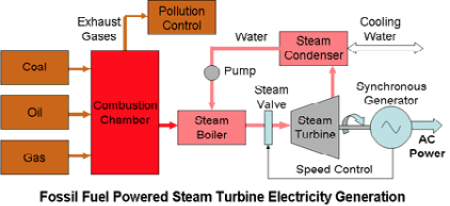
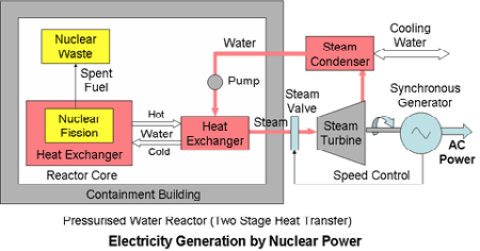
Figures 3 and 4 illustrate the common features and the differences among fossil fuel, and nuclear, power. (The steam boiler and the heat exchanger both transform the heat into steam.) The main differences are the combustion chamber, exhaust gases, and pollution control necessary for fossil fuels, compared with the reactor core, containment building, and nuclear waste necessary for nuclear fuel.
The nuclear energy discussed here is released by nuclear fission, which is the splitting of the nucleus of an atom. A power-producing nuclear reactor is “critical” the fission reaction is self-sustaining. That is, the chain reaction will continue and produce heat. As the uranium fuel is consumed, control rods need to be adjusted to keep the reactor critical. (The control rods are adjusted, in the other direction, to shut down the reactor.) The equation E = mc2 describes the amount of energy released from nuclear fission. (Energy = mass multiplied by the speed of light squared)
With fossil fuel, once the combustion is turned off, there is little residual heat to deal with. With nuclear power, even when the reactor is shut down (turned off), there is residual decay heat to remove. New reactor designs incorporate improved methods of decay heat removal, which minimizes the concern.
Fossil fuel generation involves exhaust gases and pollution control. Nuclear generation has neither exhaust gases nor pollution control, but does have nuclear waste disposal.
The Cost
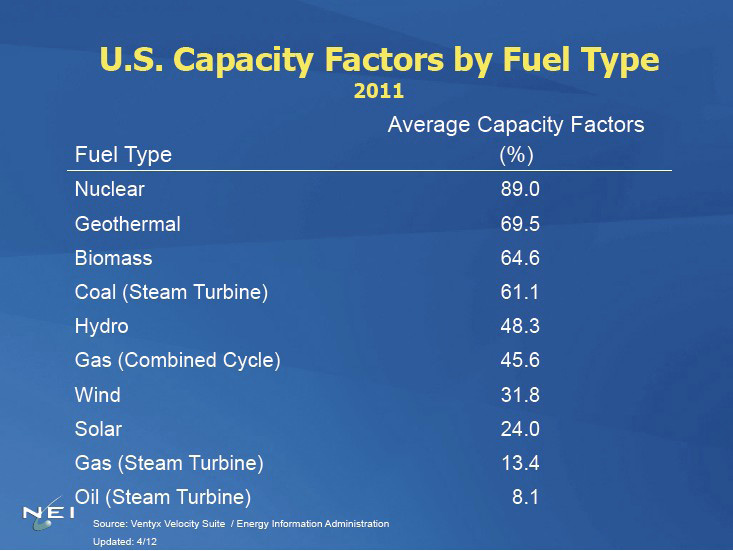
Ideally, a power plant should be operating as close to 100 percent as possible at all times. The higher the percentage, the better the power plant. If a power plant is running at a low percentage, it is not being productive. When looking at Figure 5, it is clear that nuclear fuel has the highest average capacity percentage at 89 percent. The capacity factor for coal is 61 percent, and gas steam turbines only run at an average of 13 percent.
Figure 6 illustrates the energy content of coal, natural gas, and Uranium 235 (nuclear fuel). The much higher thermal energy content of Uranium 235, compared with coal and natural gas, is apparent. This energy content translates into needing tiny quantities of Uranium 235 compared to coal and natural gas. A single uranium fuel pellet contains as much energy as 17,000 cubic feet of natural gas, 1,780 pounds of coal, or 149 gallons of oil.
Energy Sources:
|
Key |
Fossil Fuel |
Nuclear Fuel |
Thermal |
|
Generation Process |
Fuel |
Thermal Energy (Calorific Content) kWh/Kg |
|
Thermal |
Brown coal (lignite) |
2.8 |
|
Coking (black) coal |
8.3 |
|
|
Natural gas (North Sea) |
10.8 |
|
|
Oil] |
12.5 |
|
|
Diesel |
12.9 |
|
|
Petrol (gasoline) |
13.0 |
|
|
Liquefied petroleum gas (LPG), a mixture of propane and butane |
13.8 |
|
|
Uranium 235 |
22,800,000.0 |
Calorific Energy Content of Fuels and Chemicals: The energy content of various materials usually, but not always, refers to the calorific or thermal energy that can be extracted from the material, usually by burning it and using the heat in some way to generate electricity.
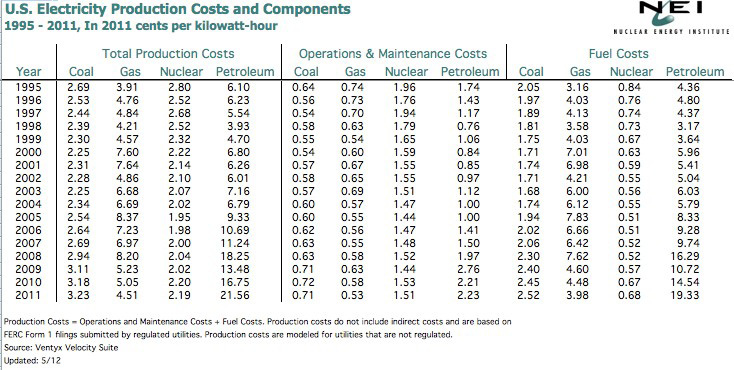
First, let’s compare the production cost by fuel type. As of 2011, nuclear energy is 2.19 cents per kWh, coal is 3.23 cents per kWh, and natural gas is 4.51 cents per kWh. The 2.19 cents per kWh includes the costs of operating and maintaining the plant, purchasing nuclear fuel, and paying for the management of used fuel. (Oil is 21.56 cents per kWh.) Figure 7 shows the production cost from 1995–2011. One major thing to notice is that the actual fuel cost for nuclear power is very low compared to the other fuels.
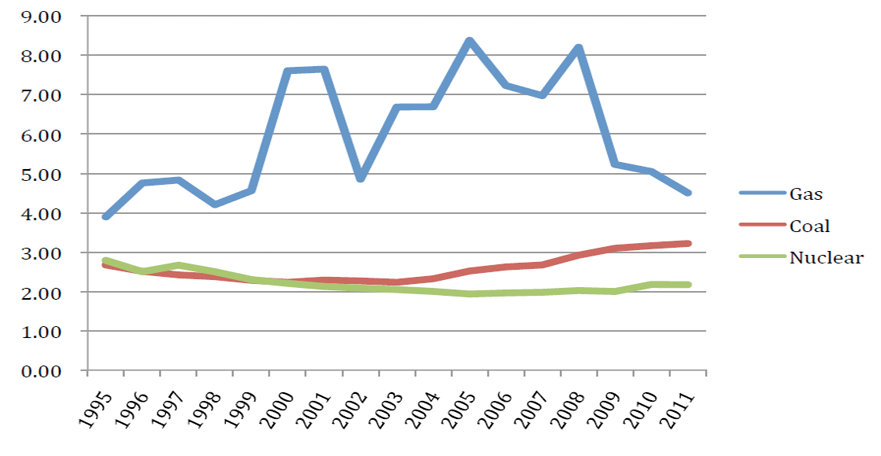
Figure 8 shows the total production costs from Figure 7 in a graphical format. The relative costs and cost trends are apparent.
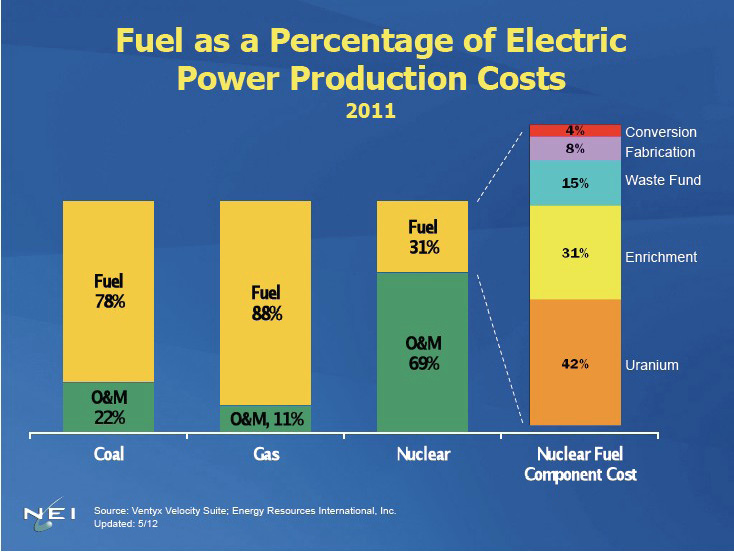
For years, nuclear energy has had a lower overall production cost than coal and natural gas. In most cases, the majority of spending is on the fuel itself, and the operations and maintenance costs are relatively low. In Figure 9, you can see that coal and gas power are both spending most of their money on fuel. Nuclear is the opposite. The fuel is cheap and the majority of the money goes to operations and maintenance, meaning more people have jobs.
Compared to coal, natural gas, and renewable energy sources, nuclear-generated electricity has tremendous price stability because only 31 percent of production costs are fuel costs. Fuel accounts for 80 to 90 percent of the cost of electricity produced by fossil fuel–fired generation, making electricity from fossil fuels highly susceptible to fluctuations in coal and gas prices.
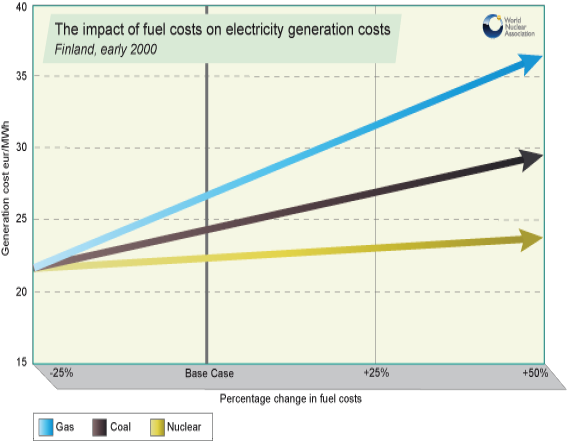
Figure 10 is from a Finnish study from 2000, which quantified fuel price sensitivity to electricity costs. This illustrates that the trend for rising fuel costs, as it impacts the rise in electricity costs, favors nuclear fuel over gas and coal. The cost comparisons favor nuclear power for the preferred energy source for growth in electrical generation.
Economic Effects
In addition to direct cost comparisons, there are other economic impacts. The average American nuclear power plant generates $470 million annually in sales of goods and services in the local community, as well as $40 million in total labor income. A Nuclear Energy Institute analysis shows that every dollar spent by the average nuclear plant results in the creation of $1.04 in the local community, $1.18 in the state economy, and $1.87 in the US economy. A nuclear power plant also generates approximately $16 million in state and local tax revenue, and about $67 million in federal tax payments annually.

In addition to direct cost comparisons, there are workforce income impacts. Figure 11 compares the number of jobs, average salaries, and workforce income among different energy sources.
Figure 11 shows that nuclear power plants create more than twice as many jobs, at higher salaries, than coal power plants. The comparison between a nuclear power plant and a natural gas plant is even more striking.
Safety
Safety is not always considered in an objective manner. People can consider nuclear power unsafe from a lack of knowledge, rather than from actual comparisons. For example, approximately 30,000 people die in traffic accidents, each year, but people do not consider automobile travel unsafe. Each year, there are no fatalities from generating electricity from nuclear power, but many consider nuclear power unsafe.
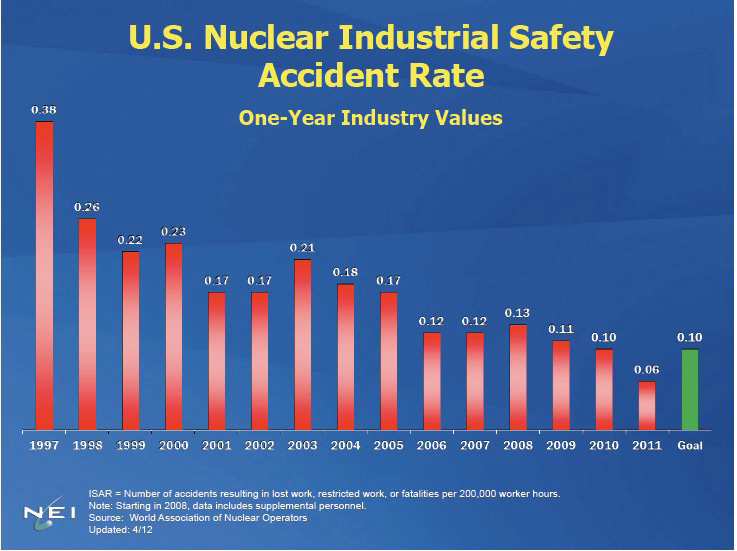
Figure 12 shows the industrial safety trend for the US nuclear industry. Note, this shows accident rates, not fatalities.
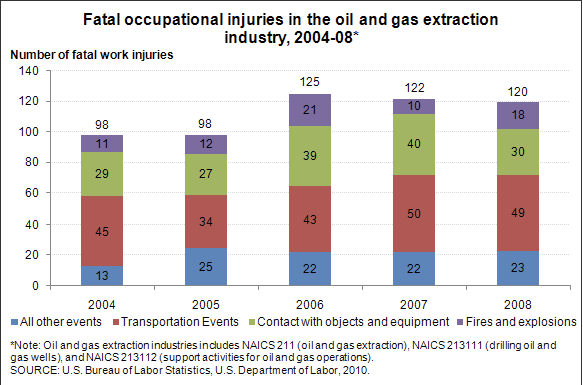
Figure 13 shows the fatalities associated with the oil and gas extraction industry.
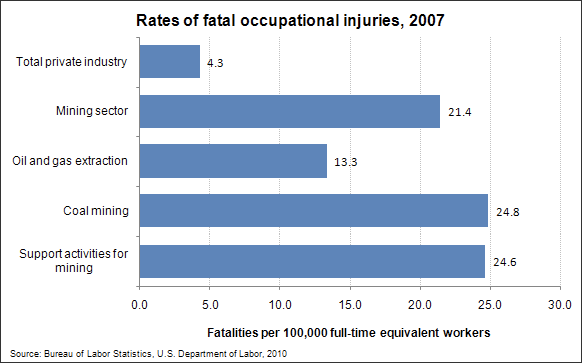
Figure 14 shows the fatalities associated with coal mining and the oil and gas extraction industry.
These charts clearly show that there are many dangers when working in the coal and natural gas industries.
There have been two nuclear disasters in the last three decades. There are preposterous amounts of coalmine explosions, oil spills, and pipeline explosions every year. Just to name a few, there was the Sabina’s Mexico coalmine explosion on May 3, 2011. Fourteen miners were killed and one was injured. Just five years before that, sixty-five miners were killed in a mine explosion in Mexico. On October 29, 2011, twenty-nine miners were killed from a gas explosion at the Xialiuchong Coal Mine in China. On March 20, 2011, forty-three miners were killed by three methane gas explosions in Pakistan. On September 12, 2011, at least seventy-five people were killed when a fuel pipeline exploded in Nairobi. These are just a few examples of disasters last year in the coal, oil, and natural gas energy industries. When looking at the numbers of fatal injuries in these industries, it is almost unfathomable.
The Environment
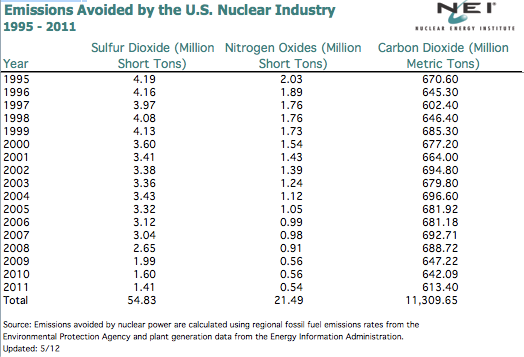
Another important aspect in the fuel comparison is the impact on the environment. Some forms of energy generation are less harmful than others. Figure 15 shows the emissions of sulfur dioxide, nitrogen oxides, and carbon dioxide avoided by the nuclear industry from 1995–2008. Other emissions from coal power plants include fly ash, mercury, arsenic, and particulates. These emissions are considered the cause of acid rain. Nuclear power avoids those emissions.
Coal mining is quite extensive compared with uranium mining. This is due to the relatively low energy content of coal compared with uranium, which translates to needing much higher volumes of coal. The deforestation of the environment for mining coal is a significant environmental impact.
The Solution
Nuclear energy is our energy source selection among coal, nuclear, and natural gas. It is significantly cheaper, it protects our people and it saves the earth.
Why are many people skeptical about nuclear power? Some do not realize the cost comparisons. Most consumers desire lower utility bills. That desire would encourage them to favor nuclear power. Many people do not know the actual record of accidents and fatalities among coal, natural gas, and nuclear power. The environmental issue is also clouded by subjective considerations. Few environmentalists promote nuclear power as a benign source of generating electricity. They (rightly) complain about atmospheric emissions from other power sources, but then somehow neglect to mention nuclear power as a possible solution.
We know better. We deserve better. If we are the stewards of this earth, it is our responsibility to do better. Nuclear power needs to have the light of truth shine on it if we are to move forward. It is time to bring this truth and allow intelligent judgments and comparisons to be made. If not for ourselves, than for our children’s future.
President Obama on Nuclear Energy
 Over the past four years, President Obama has been a very outspoken advocate for nuclear energy. Beginning in 2008 with his inaugural speech, President Obama has been making massive strides for the nuclear energy industry in the United States. After formally accepting his re-election, people need to know where he stands on energy, as it is one of our countries biggest issues. “President Obama has a real strategy to take control of our energy future and finally reduce our dependence on foreign oil—an-all-of-the- above approach to developing all of our energy resources. President Obama and his Administration are supporting the construction of the first new nuclear power plant in decades, which will provide clean electricity for nearly 1.4 million Americans.
Over the past three years, the Obama Administration has invested in grants at more than 70 universities for research and development of nuclear technologies to improve reactor design and safety (“All of the Above” 2012).
After the Fukushima accident, President Obama continued to support nuclear energy. During an interview with KOAT in Albuquerque, New Mexico, when asked about the Fukushima accident, President Obama stated, “We’ve got to budget for it. I’ve already instructed our nuclear regulatory agency to make sure that we take lessons learned from what’s happening in Japan and that we are constantly upgrading how we approach our nuclear safety in this country.”
 The Obama-appointed Nuclear Regulatory Commission (NRC) has approved four new nuclear reactors this year. President Obama has increased the amount of federal money for nuclear power plant construction by $36 billion, which brings the total funds to $54.5 billion. President Obama has proposed implementing a Clean Energy Standard, which defines clean energy as including nuclear power (Rennicks 2012).
If you are a supporter of President Obama and saving the earth, it would only make sense that you would support nuclear power. America needs to show that they support the man they re-elected as the President of the United States of America; they need to show that they trust in his decisions and that they’ve got his back.
Bibliography
“All of the Above: President Obama’s Approach to Energy Independence.” Organizing for Action. Accessed December 7, 2012. http://www.barackobama.com/energy-info/.
Baker, Nathanael. “Coal.” Energy Boom. Last updated September 19, 2012. Accessed October 1, 2012. http://www.energyboom.com/coal/10-worst-energy-related-disasters-2011
Biello, David. “Explosive Silicon Gas Casts Shadow on Solar Power Industry.” Scientific American. February 2010. Accessed November 1, 2012. http://www.scientificamerican.com/article/explosive-gas-silane-used-to-make-photovoltaics/
Bureau of Labor Statistics. “Fact Sheet: Oil and Gas Industry.” United States Department of Labor. April 2010. http://www.bls.gov/iif/oshwc/osh/os/osar0013.htm.
“Chernobyl Accident 1986.” World Nuclear Association. Accessed November 6, 2012. Last updated April 2014. http://www.world-nuclear.org/info/chernobyl/inf07.html.
“Energy and You.” United States Environmental Protection Agency. Last updated on February 19, 2014, http://www.epa.gov/cleanenergy/energy-and-you/index.html.
Gipe, Paul. “A Summary of Fatal Accidents in Wind Energy.” Wind Works. 20 2012. Accessed November 1, 2012. http://www.wind-works.org/articles/ASummaryofFatalAccidentsinWindEnergy.html.
“Hydroelectric Power.” Electropaedia. http://www.mpoweruk.com/hydro_power.htm.
Jablon, Seymour, Zdenek Hrubec, and John D. Boice. “Cancer in populations living near nuclear facilities: a survey of mortality nationwide and incidence in two states.” IAEA Bulletin 33, no. 2 (1991): 20-27.
Jackson, David. “Obama: U.S. Needs to Learn Lessons from Japan’s Nuclear Problem.” USA Today. 16 2011. Accessed December 7, 2012. http://content.usatoday.com/communities/theoval/post/2011/03/obama-us-needs-to-learn-lessons-from-japansnuclear-problems/1
Johnston, John. “Death Rate From Nuclear Power Vs. Coal?” The 9 Billion. Last updated 2011. Accessed October 10, 2012. http://www.the9billion.com/2011/03/24/death-rate-from-nuclear-power-vs-coal/.
Mine Safety and Health Administration. “Total Number of Injuries and Total Incidence Rates (IR) at Coal Mines in the United States, by Primary Activities, 1978-2007.” United States Department of Labor. http://www.msha.gov/STATS/PART50/WQ/1978/wq78cl08.asp.
Muller, Richard. “The Panic Over Fukushima.” Wall Street Journal. August 18, 2012, C1. http://online.wsj.com/article/SB10000872396390444772404577589270444059332.html.
Nuclear Energy Institute. “Nuclear Energy’s Economic Benefits—Current and Future.” White Paper. Washington D.C.: Nuclear Energy Institute, 2012.
Nuclear Energy Institute. “The Cost of New Generating Capacity in Perspective.” White Paper. Washington D.C.: Nuclear Energy Institute, 2012.
Rennicks, Jennifer. “Where Pres. Obama Stands on Energy.” Footprints: On the Path to Clean Energy (blog). CleanEnergy.org. September 7, 2012. Accessed December 7, 2012. http://blog.cleanenergy.org/2012/09/07/where-pres-obama-stands-on-energy/.
“Renewable Energy Technology Basics.” United States Department of Energy. http://energy.gov/eere/energybasics/renewable-energy-technology-basics.
U.S. Energy Information Administration. http://www.eia.gov/.
“The Economics of Nuclear Power.” World Nuclear Association. Accessed November 6, 2012. http://www.world-nuclear.org/info/inf02.html.
Long description
Figure 1 Long Description The main sources of energy for generating electricity: Coal, 49.6%; Pet Coke, 0.6%; Oil, 2.5%; Natural Gas, 18.8%; Other Gas, 0.3%; Nuclear, 19.3%; Hydro 6.5%; Other, 0.3%; Solar, 0.014%; Biomass, 1.3%; Geothermal, 0.4%. Return to Figure 1
Figure 9 Long Description Fuel as A Percentage of Electric Power Production Costs: Coal: Fuel 78%, Operation & Maintenance 22%; Gas: Fuel 88%, Operation & Maintenance, 11%; Nuclear: Fuel 31%, Operation & Maintenance 69%; Nuclear Fuel Component Cost: 4% Conversion, 8% Fabrication, 15% Waste Fund, 31% Enrichment, 42% Uranium. Source: Ventyx Velocity Suite; Energy Resources International, Inc. Updated 5/12. Return to Figure 9

