4.11 Capacity Planning and Economies of Scale
The Challenge of Matching Capacity to Demand
Manufacturing firms face a significant challenge in capacity planning: aligning production capacity with fluctuating demand. Unlike perfect scenarios with constant growth, demand often exhibits peaks and troughs. Capacity decisions, however, are long-term. Expanding capacity through machinery and labour acquisition is a relatively inflexible process, especially considering the substantial upfront investments involved.
Economies of Scale: Balancing Fixed and Variable Costs
The concept of economies of scale offers a valuable framework for navigating this challenge. It posits that the average unit cost decreases as the number of units produced increases. This stems from the principle of spreading fixed costs, like machinery depreciation, salaries, and rent, over a larger output volume. Imagine a fixed cost for a single machine. Producing 10 units with that machine will result in a higher average cost per unit compared to producing 100 units.
Leveraging Economies of Scale: Multi-Shift Operations
Manufacturing firms often exploit economies of scale by operating in multiple shifts. By utilizing the same resources (machinery and labour) for extended periods, they can produce more units, driving down the average fixed cost per unit. However, it’s crucial to recognize the impact on variable costs, which rise with increased production. These include expenses like electricity, consumables, and temporary labour. Operating multiple shifts necessitates higher utility consumption and additional workforce, leading to an increase in variable costs.
Finding the Optimal Capacity Level
The goal is to identify the optimal capacity level that minimizes total cost (fixed + variable) while maximizing production. This sweet spot represents the point where the decrease in fixed cost per unit due to increased production is offset, but not outweighed, by the increase in variable cost.
Diseconomies of Scale: The Perils of Overexpansion
It’s important to note that the cost benefits of economies of scale have limitations. Fixed cost reduction through increased output holds true only until a certain threshold. Beyond this point, additional production necessitates further investments in machinery and labour, leading to a rise in fixed costs. This phenomenon, known as Diseconomies Of Scale, results in an increase in the average unit cost. Diseconomies can arise due to complexities associated with managing a large-scale operation, including potential loss of focus, inefficiencies in resource allocation, and bureaucratic hurdles. These factors can inflate production costs and negate the initial benefits of economies of scale.
Capacity planning in a manufacturing environment requires a nuanced understanding of both economies and diseconomies of scale. By carefully considering the interplay between fixed and variable costs, firms can establish an optimal production capacity that maximizes efficiency and minimizes overall costs while remaining flexible enough to adapt to fluctuating demand.
Example: Economies and Diseconomies of Scale: LED TV Manufacturing
Imagine an LED TV manufacturer, London TV Inc. They are considering expanding their production capacity to meet rising demand. Let’s analyze how economies and diseconomies of scale might influence their decision.
Economies of Scale:
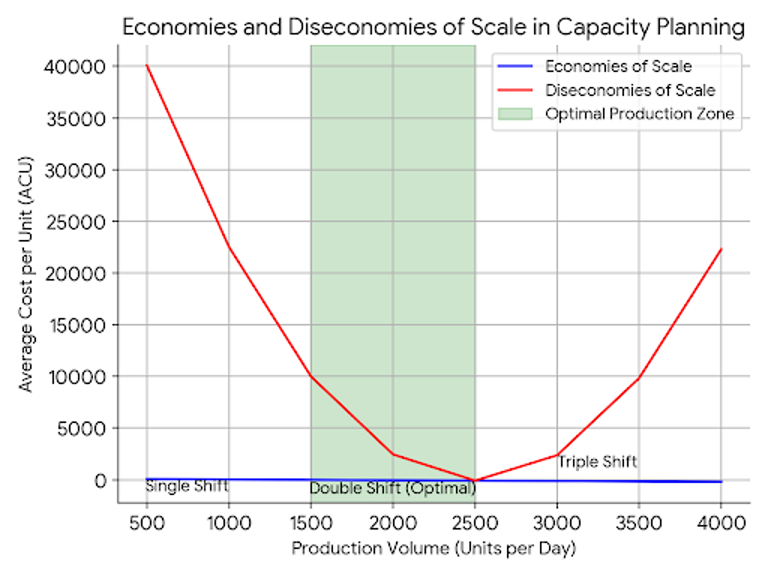
- Scenario 1: Single Shift (Low Production Volume): London TV Inc. currently operates in a single shift, producing 1,000 LED TVs per day. Fixed costs (factory rent, machinery depreciation) are spread over a smaller output, resulting in a higher average fixed cost per unit (AFCU). Variable costs (raw materials, direct labour) are also lower due to the limited production volume.
- Scenario 2: Double Shift (Increased Production Volume): London TV Inc. decides to implement a double shift, effectively doubling their production to 2,000 LED TVs per day. The fixed costs remain relatively constant but are now spread over a larger output. This leads to a significant decrease in AFCU. Variable costs will increase due to additional labour and utility consumption, but likely at a lower rate compared to the fixed cost reduction. The overall average cost per unit (ACU) decreases due to economies of scale.
Diseconomies of Scale:
- Scenario 3: Triple Shift (Excessive Production Volume): Enticed by continued demand growth, London TV Inc. pushes for a triple shift, aiming for 3,000 LED TVs daily. While AFCU continues to decrease, additional challenges arise. Managing a larger workforce and complex logistics can lead to inefficiencies. More equipment might necessitate additional factory space, increasing fixed costs. Variable costs for raw materials, labour, and utilities soar. The overall ACU might start to increase due to diseconomies of scale.
Prompt Detail
Prompt: Can you share an example with a figure for ‘Economies and diseconomies of scale’ in capacity planning? I need a figure with an example
mport matplotlib.pyplot as plt
import numpy as np
# Define production volume
production_volume = np.arange(500, 4001, 500)
# Simulate average cost per unit (ACU) with economies and diseconomies of scale
acu_economies = 100 – 0.075 * production_volume # Decreasing cost due to economies of scale
acu_diseconomies = acu_economies + 0.01 * (production_volume – 2500)**2 # Increasing cost due to diseconomies
# Plot ACU vs production volume
plt.plot(production_volume, acu_economies, label=’Economies of Scale’, color=’blue’)
plt.plot(production_volume, acu_diseconomies, label=’Diseconomies of Scale’, color=’red’)
plt.xlabel(‘Production Volume (Units per Day)’)
plt.ylabel(‘Average Cost per Unit (ACU)’)
plt.title(‘Economies and Diseconomies of Scale in Capacity Planning’)
plt.legend()
# Indicate optimal production zone
plt.axvspan(1500, 2500, alpha=0.2, color=’green’, label=’Optimal Production Zone’)
plt.legend()
# Add annotations for key points
plt.annotate(‘Single Shift’, xy=(1000, acu_economies[1]), # Point A
arrowprops=dict(facecolor=’black’, shrink=0.05),
horizontalalignment=’right’, verticalalignment=’top’)
plt.annotate(‘Double Shift (Optimal)’, xy=(2000, acu_economies[3]), # Point B
arrowprops=dict(facecolor=’black’, shrink=0.05),
horizontalalignment=’center’, verticalalignment=’top’)
plt.annotate(‘Triple Shift’, xy=(3000, acu_diseconomies[5]), # Point C
arrowprops=dict(facecolor=’black’, shrink=0.05),
horizontalalignment=’left’, verticalalignment=’top’)
plt.grid(True)
plt.show()
The optimal production level for London TV Inc. lies in the zone of economies of scale (Scenario 2), where the Average Cost per Unit curve reaches its minimum point. Beyond this point (Scenario 3), diseconomies of scale set in, causing the Average Cost Per Unit to rise.
Video: “Economies of Scale in One Minute: Definition/Theory, Explanation and Examples” by One Minute Economics [1:44] is licensed under the Standard YouTube License.Transcript and closed captions available on YouTube.
“Capacity Planning: Importance and Measures” in Operations Management by Vikas Singla is licensed under a Creative Commons Attribution-NonCommercial 4.0 International Licence, except where otherwise noted. Modifications: adapted 17.2.3 Economies of Scale. Added an example.
Microsoft. (2024, June 4). Copilot [Large language model]. https://copilot.microsoft.com/.
