5.3 Methods for Finding the Best Facility Location
Location Factor Rating Method
One effective method for assisting in the selection of the optimal facility location is the Location Factor Rating, also known as the Weighted Scoring Model. This approach involves the following steps:
- Identify Key Location Factors: Determine the various factors that are crucial in the facility location decision, such as proximity to suppliers, business environment, wage rates, community characteristics, proximity to customers, availability of labour pool, and accessibility to transportation hubs.
- Assign Weights: Assign a weight between 0 and 1.0 to each factor, reflecting its relative importance in the decision-making process. The sum of all weights should equal 1.0.
- Score Potential Locations: Evaluate each potential location site against each factor and assign a score, typically on a scale of 0 to 100, with higher scores indicating better performance for that particular factor.
- Calculate Weighted Scores: For each potential location, multiply the score for each factor by its corresponding weight to obtain the weighted score for that factor.
- Determine the Optimal Location: Sum the weighted scores for each potential location. The location with the highest total weighted score is considered the most attractive option based on the collective evaluation of all factors.
Example
Let's consider an example with three potential locations (Site #1, Site #2, and Site #3) and the following location factors and weights:
| Location Factor | Weight | Site #1 | Site #2 | Site #3 |
|---|---|---|---|---|
| Proximity to Suppliers | 0.3 | 80 | 85 | 80 |
| Business Environment | 0.25 | 65 | 90 | 55 |
| Wage Rates | 0.15 | 72 | 55 | 65 |
| Community | 0.1 | 65 | 60 | 40 |
| Proximity to Customers | 0.1 | 55 | 90 | 70 |
| Labour Pool | 0.05 | 40 | 45 | 65 |
| Proximity to Airport | 0.05 | 60 | 55 | 80 |
By calculating the weighted scores for each site, we obtain the following results:
| Location Factor | Site #1 | Site #2 | Site #3 |
|---|---|---|---|
| Proximity to Suppliers | 24.0 | 25.5 | 24.0 |
| Business Environment | 16.3 | 22.5 | 13.8 |
| Wage Rates | 10.8 | 8.3 | 9.8 |
| Community | 6.5 | 6.0 | 4.0 |
| Proximity to Customers | 5.5 | 9.0 | 7.0 |
| Labour Pool | 2.0 | 2.3 | 3.3 |
| Proximity to Airport | 3.0 | 2.8 | 4.0 |
| Total Score | 68.1 | 76.3 | 65.8 |
In this example, Site #2 exhibits the highest total weighted score when evaluated against Site #1 and Site #3. Therefore, based on the collective assessment of all factors, Site #2 would be considered the most attractive location for the facility.
The Location Factor Rating Method provides a structured and quantitative approach to facility location decisions, allowing organizations to objectively evaluate and compare potential sites based on their specific operational requirements and strategic priorities.
Centre of Gravity Method
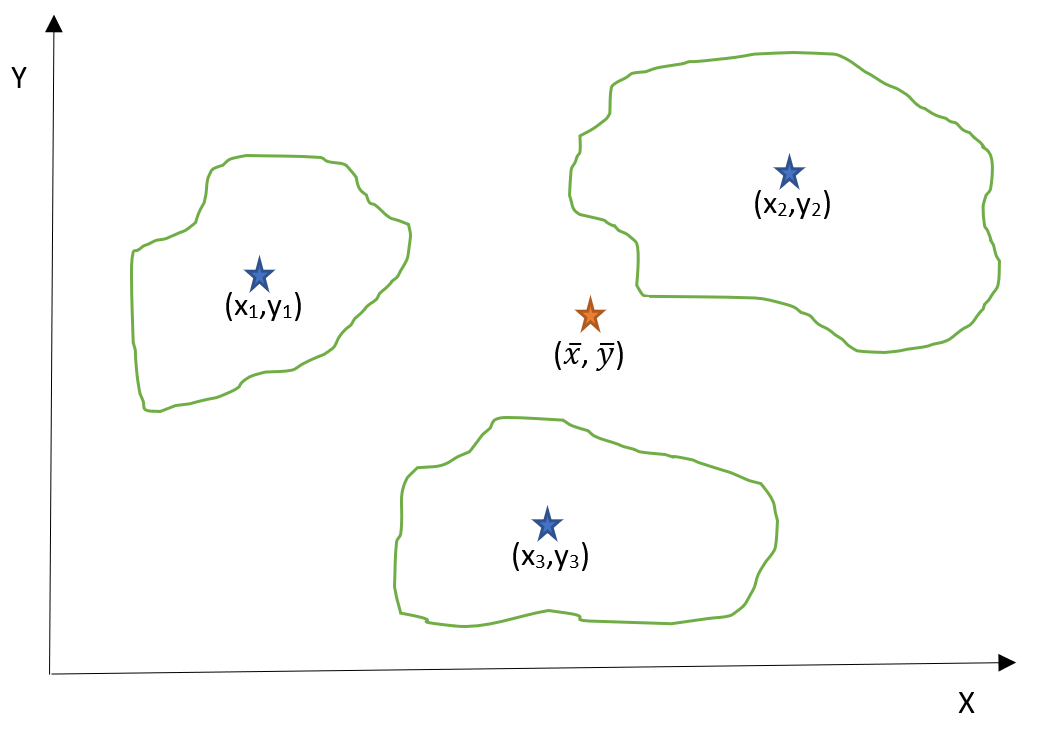
When the primary objective is to minimize transportation costs, the Centre of Gravity Method can be employed to determine the optimal location for a facility that serves multiple areas or other facilities, such as a warehouse or distribution center. This method utilizes an (X-Y) coordinate system to represent the geographical map of the areas under consideration. It identifies the x and y coordinates for the location of the new facility based on the coordinates of the other facilities and the volume (quantity) of demand for each area.
Visual Representation
Imagine a scenario where each blue star in the following figure represents a market area that needs to be served, and the size of the area corresponds to the demand quantity for that market. The goal is to determine the optimal location (i.e., x̄ and ȳ) for our facility to be set up to serve all these markets while minimizing the total transportation costs.
Mathematical Formulation
The Centre of Gravity method employs the following formulas to calculate the x and y coordinates for the new facility:
In the following, we show the formulas and use them in an example:
[latex]\overline x={\textstyle\frac{\sum x_iQ_i}{\sum Q_i}}[/latex]
[latex]\overline y={\textstyle\frac{\sum y_iQ_i}{\sum Q_i}}[/latex]
Where:
x̄ = the x coordinate for the new facility
ȳ = the y coordinate for the new facility
xi = x coordinate of destination (market) i
yi = y coordinate of destination (market) i
Qi = quantity to be transported to destination I
Example
Consider the following information about potential markets and their respective locations:
| Market | Volume | X | Y |
|---|---|---|---|
| London | 600 | 1 | 2 |
| Toronto | 400 | 3 | 4 |
| Kingston | 550 | 6 | 4 |
| Barrie | 800 | 2 | 6 |
Using the Centre of Gravity method, we can determine the optimal location for the new facility to minimize the total transportation cost:
[latex]\overline x=\frac{1(600)+3(400)+6(550)+2(800)}{600+400+550+800}=2.9[/latex]
[latex]\overline y=\frac{2(600)+4(400)+4(550)+6(800)}{600+400+550+800}=4.2[/latex]
By substituting the given values into the formulas, the x and y coordinates for the new facility can be calculated, representing the location that minimizes the total transportation cost while serving all the markets.
The Centre of Gravity method provides a quantitative approach to facility location decisions, specifically when the primary objective is to minimize transportation costs associated with serving multiple areas or facilities. Considering the demand volumes and geographical coordinates, this method helps organizations identify the optimal location that optimizes transportation efficiency and reduces overall logistics costs.
Break-Even Method
A common practice in selecting a business site is to compare the cost of production between multiple locations. The fixed costs (land, building, rent) and variable costs (labour, material, utility, etc.) would be different in each location. What is common between these sites is that they should produce the forecasted quantity that is demanded in the market. The forecasted demand could be a single quantity (e.g. 10,000 bikes) or fall within a range (e.g. 10,000-20,000 bikes). To determine which location should provide the demanded quantity or quantities, we use a break-even analysis of their production costs or projected profit levels. This can be done by formulating the total cost of each location in a simple linear equation and depicting the total cost graph of all locations or using Excel to do the same. The following video explains the procedure.
Video: "Locational Break Even Analysis" by Stephanie Powers [13:03] is licensed under the Standard YouTube License.Transcript and closed captions available on YouTube.
"8 Facility Location" from Introduction to Operations Management Copyright © by Hamid Faramarzi and Mary Drane is licensed under a Creative Commons Attribution-NonCommercial-ShareAlike 4.0 International License, except where otherwise noted.—Modifications: used section Methods for Finding the Best Facility Location, some paragraphs rewritten; added additional explanations; added section on Break Even Method.
