34 6.2 Overview of Site Index
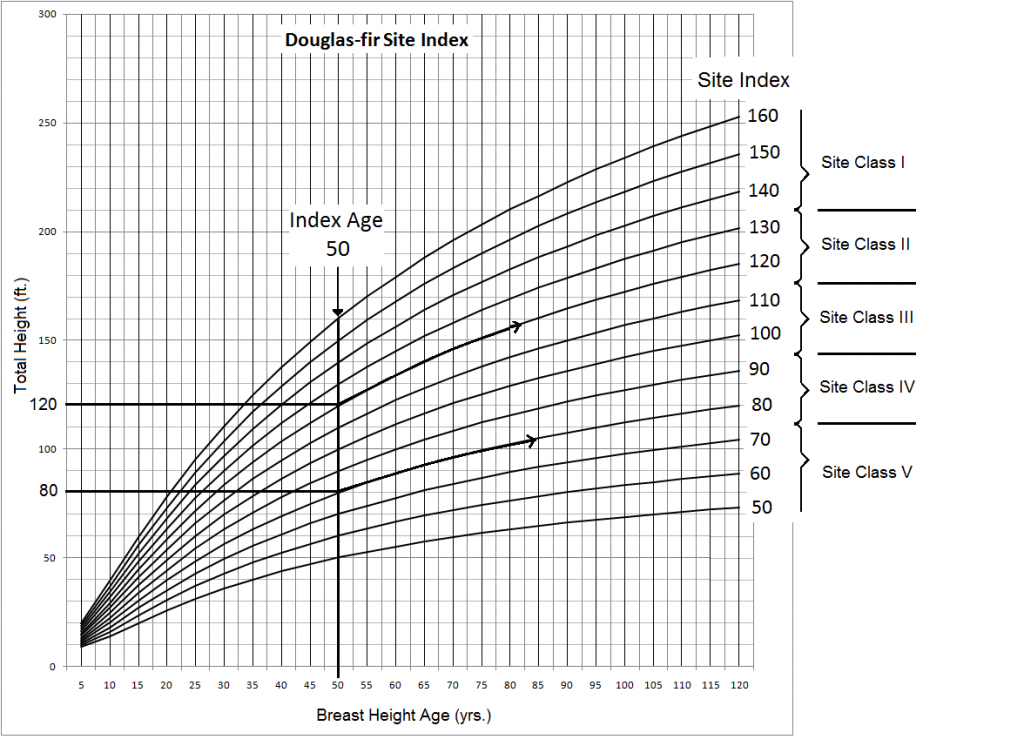
To determine site quality using tree height as the indicator, appropriate site trees of each species are selected in a stand. The site trees’ heights and ages are measured in the field, and then plotted or indexed on species-specific growth curves or tables (see Figure 6.3). These tree height-to-age relationship curves are derived from historical growth and yield field data, and show how the best trees from a variety of sites have grown over time without intensive management or site quality intervention. For a given species, a tree that is 120 feet tall at age 50 typically has better growing conditions than a tree that is only 80 feet tall at age 50. And, as indicated by the growth curves, the shorter tree will most likely continue to grow at a slower rate as it ages (Figure 6.3). There are exceptions to these generalized trends of course, but for most sites the general trends are sufficiently reliable.

Site Index (SI) is defined as the height of dominant and codominant trees at some base age. Therefore, a stand with an average 50-year site index of 120 would indicate that the trees are capable of reaching a total height of 120 feet at 50 years. By establishing a base age, stands of any age can be evaluated and compared, and thus the number “120” becomes an index to the site’s productivity. This can then be evaluated as a high site or low site when compared with other tree heights at this age.
Site indexes for some species are grouped together into site classes, with Site Class I being the highest site, and Site Class V or VI being the lowest. In othe first example above for Douglas-fir, the tree whose 50-year site index is 80 feet is in Site Class IV, whereas the 120 foot tree is growing on Site Class II ground (Figure 6.3).
Trees growing on Site Class I lands are highly productive, typically growing on rich soil, with access to moisture and protection from the wind. Alluvial sites at low elevations often fall into this category. Conversely, Site Class V trees are generally growing on poor soils, in droughty climates, or at the upper edge of their elevational range.

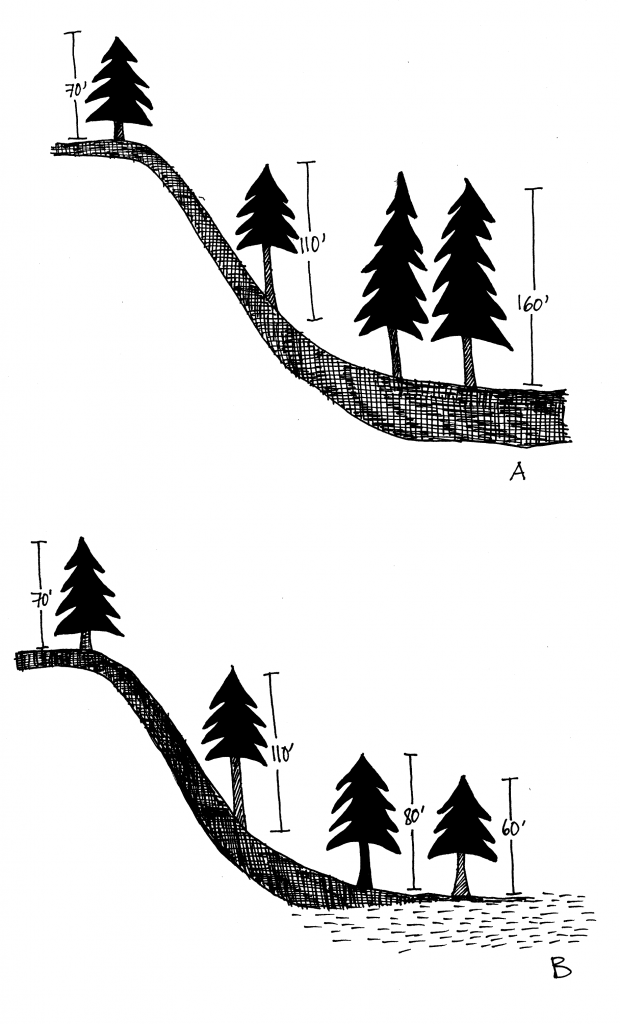
Site class may also vary on a single slope. The ridgetop, exposed to wind and erosion, may produce trees that fall into Site Class III, whereas the toe of the slope, with less exposed rock and deeper soils collecting that eroded material, is Site Class II (Figure 6.4: A). Further, trees growing midslope with good drainage and plenty of sun may grow taller than the same species at the base of the slope in a riparian area, if rooting depth is restricted by a high water table (Figure 6.4: B).

