Conceptual Questions
Conceptual Questions
2.1 Displacement
- Give an example in which there are clear distinctions among distance traveled, displacement, and magnitude of displacement. Specifically identify each quantity in your example.
- Under what circumstances does distance traveled equal magnitude of displacement? What is the only case in which magnitude of displacement and displacement are exactly the same?
- Bacteria move back and forth by using their flagella (structures that look like little tails). Speeds of up to [latex]\text{50 }\mu\text{m}/\text{s } \left(\text{50} \times \text{10}^{- 6} \text{ m}/\text{s}\right)[/latex] have been observed. The total distance traveled by a bacterium is large for its size, while its displacement is small. Why is this?
2.2 Vectors, Scalars, and Coordinate Systems
- A student writes, “A bird that is diving for prey has a speed of
[latex]- \textit{10} m / s[/latex].” What is wrong with the student’s statement? What has the student actually described? Explain. - What is the speed of the bird in Exercise 2.4?
- Acceleration is the change in velocity over time. Given this information, is acceleration a vector or a scalar quantity? Explain.
- A weather forecast states that the temperature is predicted to be [latex]- 5ºC[/latex] the following day. Is this temperature a vector or a scalar quantity? Explain.
2.3 Time, Velocity, and Speed
- Give an example (but not one from the text) of a device used to measure time and identify what change in that device indicates a change in time.
- There is a distinction between average speed and the magnitude of average velocity. Give an example that illustrates the difference between these two quantities.
- Does a car’s odometer measure distance traveled or displacement? Does its speedometer measure speed or velocity?
- If you divide the total distance traveled on a car trip (as determined by the odometer) by the time for the trip, are you calculating the average speed or the magnitude of the average velocity? Under what circumstances are these two quantities the same?
- How are instantaneous velocity and instantaneous speed related to one another? How do they differ?
2.4 Acceleration
- Is it possible for speed to be constant while acceleration is not zero? Give an example of such a situation.
- Is it possible for velocity to be constant while acceleration is not zero? Explain.
- Give an example in which velocity is zero yet acceleration is not.
- If a subway train is moving to the left (has a negative velocity) and then comes to a stop, what is the direction of its acceleration? Is the acceleration positive or negative?
- Plus and minus signs are used in one-dimensional motion to indicate direction. What is the sign of an acceleration that reduces the magnitude of a negative velocity? Of a positive velocity?
2.6 Problem-Solving Basics for One-Dimensional Kinematics
- What information do you need in order to choose which equation or equations to use to solve a problem? Explain.
- What is the last thing you should do when solving a problem? Explain.
2.7 Falling Objects
- What is the acceleration of a rock thrown straight upward on the way up? At the top of its flight? On the way down?
- An object that is thrown straight up falls back to Earth. This is one-dimensional motion. (a) When is its velocity zero? (b) Does its velocity change direction? (c) Does the acceleration due to gravity have the same sign on the way up as on the way down?
- Suppose you throw a rock nearly straight up at a coconut in a palm tree, and the rock misses on the way up but hits the coconut on the way down. Neglecting air resistance, how does the speed of the rock when it hits the coconut on the way down compare with what it would have been if it had hit the coconut on the way up? Is it more likely to dislodge the coconut on the way up or down? Explain.
- If an object is thrown straight up and air resistance is negligible, then its speed when it returns to the starting point is the same as when it was released. If air resistance were not negligible, how would its speed upon return compare with its initial speed? How would the maximum height to which it rises be affected?
- The severity of a fall depends on your speed when you strike the ground. All factors but the acceleration due to gravity being the same, how many times higher could a safe fall on the Moon be than on Earth (gravitational acceleration on the Moon is about 1/6 that of the Earth)?
- How many times higher could an astronaut jump on the Moon than on Earth if his takeoff speed is the same in both locations (gravitational acceleration on the Moon is about 1/6 of [latex]g[/latex] on Earth)?
2.8 Graphical Analysis of One-Dimensional Motion
- (a) Explain how you can use the graph of position versus time in Figure 2.52 to describe the change in velocity over time. Identify (b) the time ([latex]t_{a}[/latex], [latex]t_{b}[/latex], [latex]t_{c}[/latex], [latex]t_{d}[/latex], or [latex]t_{e}[/latex]) at which the instantaneous velocity is greatest, (c) the time at which it is zero, and (d) the time at which it is negative.
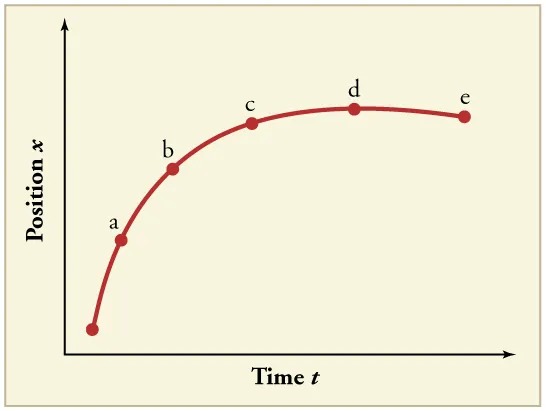
Figure 2.52 Image from OpenStax College Physics 2e, CC-BY 4.0
Image Description
The image is a graph with a light background, showing a curved line that represents a relationship between time and position.
– Axes:
– The horizontal axis is labeled “Time t.”
– The vertical axis is labeled “Position x.”
– Graph Line:
– The red curved line starts at the bottom left and curves upward, then levels off, moving towards the right.
– Points:
– Five marked points labeled from “a” to “e” are placed along the curve at intervals, representing different times and positions.
– Point “a” is positioned lowest on the curve, and point “e” is highest.
The curve suggests that as time progresses, the position increases rapidly at first, then the rate of increase slows down, eventually leveling off. This curve may represent deceleration or an approach to a maximum position, illustrating a common type of dynamic behavior.
- (a) Sketch a graph of velocity versus time corresponding to the graph of position versus time given in Figure 2.53. (b) Identify the time or times ([latex]t_{a}[/latex],
[latex]t_{b}[/latex],
[latex]t_{c}[/latex], etc.) at which the instantaneous velocity is greatest. (c) At which times is it zero? (d) At which times is it negative?
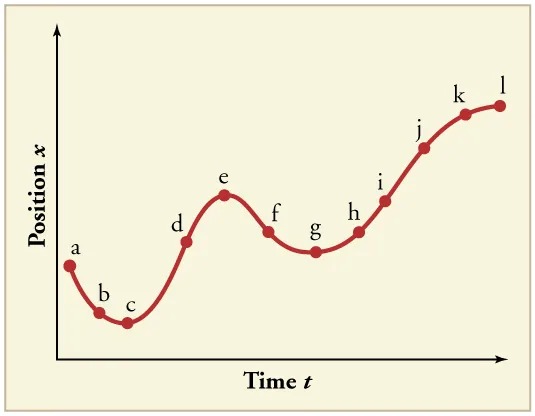
Figure 2.53 Image from OpenStax College Physics 2e, CC-BY 4.0
Image Description
The image is a graph illustrating the position of an object over time. The x-axis is labeled “Time t” and the y-axis is labeled “Position x”. The graph is plotted with a smooth red curve that shows changes in position at different time intervals.
Key points along the curve are marked with lowercase letters from ‘a’ to ‘l’, with points spaced along the curve. The shape of the curve indicates fluctuations, showing peaks at points ‘d’, ‘e’, ‘j’, and ‘l’, and troughs at points ‘c’, ‘f’, and ‘h’.
The graph depicts a general upward trend over time despite the fluctuations, indicating increasing position as time progresses. The background is a light beige color, and the axes are represented by black arrows indicating the direction of increase for both time and position.
- (a) Explain how you can determine the acceleration over time from a velocity versus time graph such as the one in Figure 2.54. (b) Based on the graph, how does acceleration change over time?
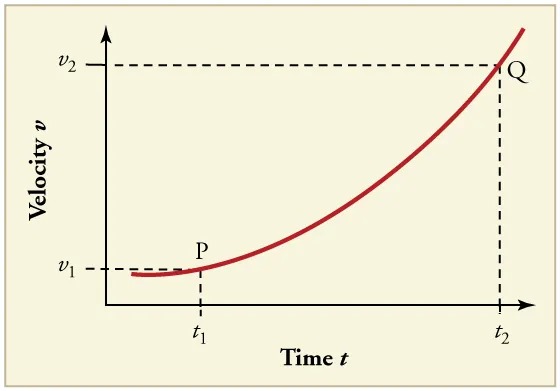
Figure 2.54 Image from OpenStax College Physics 2e, CC-BY 4.0
Image Description
The image shows a graph with labeled axes, depicting the relationship between velocity and time. The x-axis is labeled “Time t” and the y-axis is labeled “Velocity v.” The graph displays a curve starting at a point labeled P and ending at a point labeled Q.
The significant points on the axes are marked: the y-axis has values labeled as v1 (lower) and v2 (higher), while the x-axis has points t1 and t2 corresponding to specific time values.
The curve starts at point P with velocity v1 at time t1, showing an upward trend and gaining steepness as it approaches point Q, where it reaches velocity v2 at time t2. Dashed lines extend from the points on the curve to the axes, showing the correspondence of each point to its velocity and time values.
- (a) Sketch a graph of acceleration versus time corresponding to the graph of velocity versus time given in Figure 2.55. (b) Identify the time or times ([latex]t_{a}[/latex],
[latex]t_{b}[/latex], [latex]t_{c}[/latex], etc.) at which the acceleration is greatest. (c) At which times is it zero? (d) At which times is it negative?
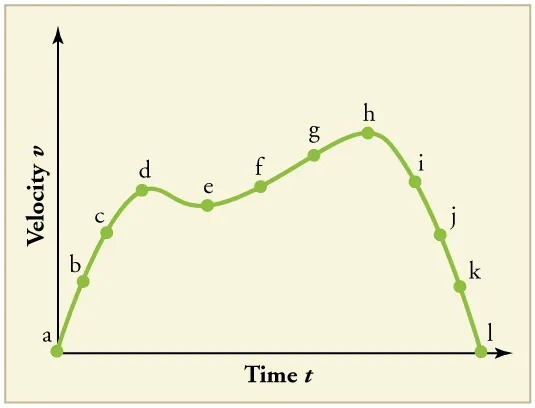
Figure 2.55 Image from OpenStax College Physics 2e, CC-BY 4.0
Image Description
The image is a graph illustrating the relationship between velocity and time. The horizontal axis is labeled “Time t,” and the vertical axis is labeled “Velocity v.”
The graph is a curved green line depicting changes in velocity over time with various labeled points from “a” to “l”:
– Point “a” is at the origin (0,0), indicating zero velocity at time zero.
– From “a” to “b,” the velocity increases.
– From “b” to “d,” the velocity continues to rise but at a slower rate, showing a decrease in acceleration.
– Points “d” and “e” are peaks where the velocity is relatively stable.
– From “e” to “f,” there is a slight decrease, followed by an increase in velocity to point “g.”
– Point “h” is the highest point on the graph.
– From “h” to “i,” the velocity starts to decrease.
– After point “i,” from “j” to “k,” the velocity decreases sharply.
– Finally, from “k” to “l,” the velocity returns to zero, similar to the starting point “a.”
The overall shape of the graph resembles a hill, where the peak is at point “h.”
- Consider the velocity vs. time graph of a person in an elevator shown in Figure 2.56. Suppose the elevator is initially at rest. It then accelerates for 3 seconds, maintains that velocity for 15 seconds, then decelerates for 5 seconds until it stops. The acceleration for the entire trip is not constant so we cannot use the equations of motion from 2.5 Motion Equations for Constant Acceleration in One Dimension for the complete trip. (We could, however, use them in the three individual sections where acceleration is a constant.) Sketch graphs of (a) position vs. time and (b) acceleration vs. time for this trip.
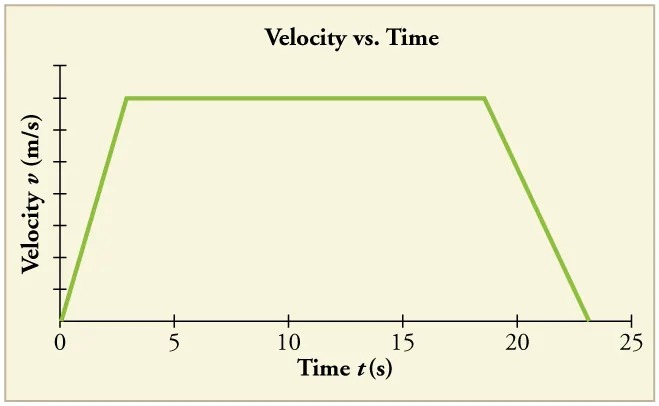
Figure 2.56 Image from OpenStax College Physics 2e, CC-BY 4.0
Image Description
The image is a graph titled “Velocity vs. Time.” It plots velocity (v) in meters per second (m/s) on the vertical y-axis against time (t) in seconds (s) on the horizontal x-axis. The graph is set on a light beige background and is bordered in light brown.
The y-axis, labeled “Velocity v (m/s),” ranges from 0 to 40 m/s with markings at intervals of 5 m/s. The x-axis, labeled “Time t (s),” ranges from 0 to 25 seconds with markings at intervals of 5 seconds.
The graph consists of a green line that illustrates the change in velocity over time. The line starts at the origin (0,0) and increases steeply until it reaches a maximum velocity around 5 seconds. Then, it maintains this constant velocity until roughly 20 seconds, after which it decreases steeply back to 0 m/s at 25 seconds, forming a trapezoidal shape.
- A cylinder is given a push and then rolls up an inclined plane. If the origin is the starting point, sketch the position, velocity, and acceleration of the cylinder vs. time as it goes up and then down the plane.
