2.7 Falling Objects
Learning Objectives
By the end of this section, you will be able to:
- Describe the effects of gravity on objects in motion.
- Describe the motion of objects that are in free fall.
- Calculate the position and velocity of objects in free fall.
Falling objects form an interesting class of motion problems. For example, we can estimate the depth of a vertical mine shaft by dropping a rock into it and listening for the rock to hit the bottom. By applying the kinematics developed so far to falling objects, we can examine some interesting situations and learn much about gravity in the process.
Gravity
The most remarkable and unexpected fact about falling objects is that, if air resistance and friction are negligible, then in a given location all objects fall toward the center of Earth with the same constant acceleration, independent of their mass. This experimentally determined fact is unexpected, because we are so accustomed to the effects of air resistance and friction that we expect light objects to fall slower than heavy ones.
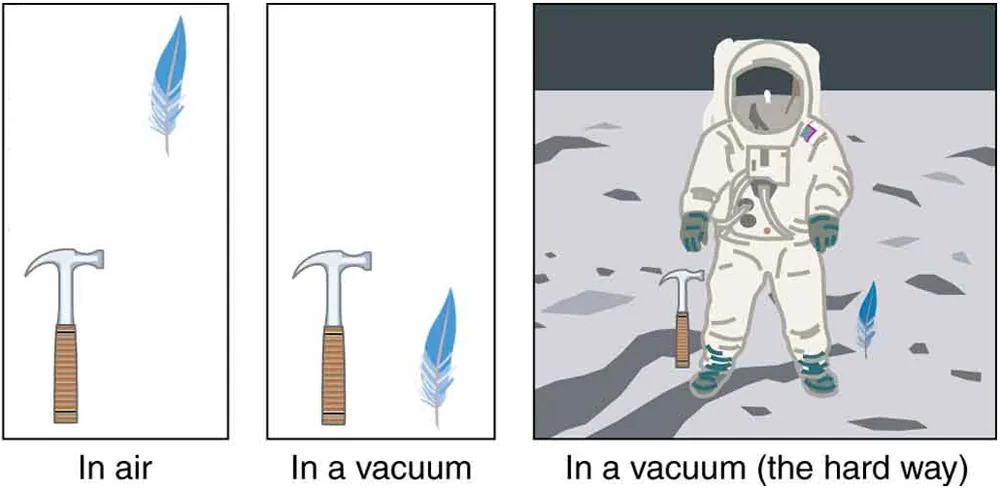
Figure 2.37 A hammer and a feather will fall with the same constant acceleration if air resistance is
considered negligible. This is a general characteristic of gravity not unique to Earth, as astronaut
David R. Scott demonstrated on the Moon in 1971, where the acceleration due to gravity is only [latex]1 . \text{67 m}/\text{s}^{2}[/latex]. Image from OpenStax College Physics 2e, CC-BY 4.0
In the real world, air resistance can cause a lighter object to fall slower than a heavier object of the same size. A tennis ball will reach the ground after a hard baseball dropped at the same time. (It might be difficult to observe the difference if the height is not large.) Air resistance opposes the motion of an object through the air, while friction between objects—such as between clothes and a laundry chute or between a stone and a pool into which it is dropped—also opposes motion between them. For the ideal situations of these first few chapters, an object falling without air resistance or friction is defined to be in free-fall.
The force of gravity causes objects to fall toward the center of Earth. The acceleration of free-falling objects is therefore called the acceleration due to gravity. The acceleration due to gravity is constant, which means we can apply the kinematics equations to any falling object where air resistance and friction are negligible. This opens a broad class of interesting situations to us. The acceleration due to gravity is so important that its magnitude is given its own symbol, [latex]g[/latex]. It is constant at any given location on Earth and has the average value
[latex]g = 9 . \text{80 m}/\text{s}^{2} .[/latex]
Although [latex]g[/latex] varies from [latex]9 . \text{78 m}/\text{s}^{2}[/latex] to [latex][/latex][latex]9 . \text{83 m}/\text{s}^{2}[/latex], depending on latitude, altitude, underlying geological formations, and local topography, the average value of [latex]9 . \text{80 m}/\text{s}^{2}[/latex] will be used in this text unless otherwise specified. The direction of the acceleration due to gravity is downward (towards the center of Earth). In fact, its direction defines what we call vertical. Note that whether the acceleration [latex]a[/latex] in the kinematic equations has the value [latex]+ g[/latex] or [latex]- g[/latex] depends on how we define our coordinate system. If we define the upward direction as positive, then [latex]a = - g = - 9 . \text{80 m}/\text{s}^{2}[/latex], and if we define the downward direction as positive, then [latex]a = g = 9 . \text{80 m}/\text{s}^{2}[/latex].
One-Dimensional Motion Involving Gravity
The best way to see the basic features of motion involving gravity is to start with the simplest situations and then progress toward more complex ones. So we start by considering straight up and down motion with no air resistance or friction. These assumptions mean that the velocity (if there is any) is vertical. If the object is dropped, we know the initial velocity is zero. Once the object has left contact with whatever held or threw it, the object is in free-fall. Under these circumstances, the motion is one-dimensional and has constant acceleration of magnitude [latex]g[/latex]. We will also represent vertical displacement with the symbol [latex]y[/latex] and use [latex]x[/latex] for horizontal displacement.
Kinematic Equations for Objects in Free-Fall where Acceleration [latex]{\color{white}=-g}[/latex]
[latex]v = v_{0} - \text{gt}[/latex]
[latex]y = y_{0} + v_{0} t - \frac{1}{2} \text{gt}^{2}[/latex]
[latex]v^{2} = v_{0}^{2} - 2 g \left(y - y_{0}\right)[/latex]
Example 2.14
Calculating Position and Velocity of a Falling Object: A Rock Thrown Upward
A person standing on the edge of a high cliff throws a rock straight up with an initial velocity of 13.0 m/s. The rock misses the edge of the cliff as it falls back to earth. Calculate the position and velocity of the rock 1.00 s, 2.00 s, and 3.00 s after it is thrown, neglecting the effects of air resistance.
Strategy
Draw a sketch.
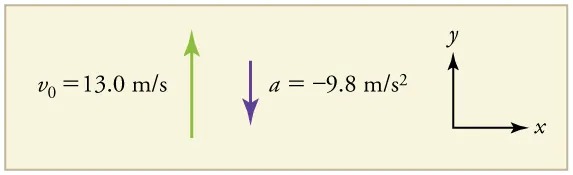
Figure 2.38 Image from OpenStax College Physics 2e, CC-BY 4.0
Image Description
The image is an illustration displaying initial velocity and acceleration in a two-dimensional coordinate system. On the left, there’s a mathematical notation indicating the initial velocity:
v0 = 13.0 m/s
accompanied by a green arrow pointing upwards, representing the positive initial velocity direction. Next to it, there’s an equation for acceleration:
a = -9.8 m/s2
paired with a purple arrow pointing downwards, illustrating the negative acceleration due to gravity. On the right side of the image, there’s a two-dimensional coordinate system with horizontal and vertical axes labeled as x and y respectively. The y-axis is vertical, and the x-axis is horizontal.
We are asked to determine the position [latex]y[/latex] at various times. It is reasonable to take the initial position [latex]y_{0}[/latex] to be zero. This problem involves one-dimensional motion in the vertical direction. We use plus and minus signs to indicate direction, with up being positive and down negative. Since up is positive, and the rock is thrown upward, the initial velocity must be positive too. The acceleration due to gravity is downward, so [latex]a[/latex] is negative. It is crucial that the initial velocity and the acceleration due to gravity have opposite signs. Opposite signs indicate that the acceleration due to gravity opposes the initial motion and will slow and eventually reverse it.
Since we are asked for values of position and velocity at three times, we will refer to these as
[latex]y_{1}[/latex] and [latex]v_{1}[/latex]; [latex]y_{2}[/latex] and
[latex]v_{2}[/latex]; and [latex]y_{3}[/latex] and [latex]v_{3}[/latex].
Solution for Position [latex]y_{1}[/latex]
1. Identify the knowns. We know that [latex]y_{0} = 0[/latex]; [latex]v_{0} = \text{13} . \text{0 m}/\text{s}[/latex]; [latex]a = - g = - 9 . \text{80 m}/\text{s}^{2}[/latex]; and
[latex]t = 1 . \text{00 s}[/latex].
2. Identify the best equation to use. We will use [latex]y = y_{0} + v_{0} t + \frac{1}{2} \text{at}^{2}[/latex] because it includes only one unknown, [latex]y[/latex] (or [latex]y_{1}[/latex], here), which is the value we want to find.
3. Plug in the known values and solve for [latex]y_{1}[/latex].
[latex]\begin{align*}y \_{1}^{} &= 0 + \left(\text{13} . \text{0 m}/\text{s}\right) \left(1 . \text{00 s}\right) + \frac{1}{2} \left(- 9 . \text{80} \text{m}/\text{s}^{2}\right) \left(1 . \text{00 s}\right)^{2}\\ &= 8 . \text{10} \text{m}\end{align*}[/latex]
Discussion
The rock is 8.10 m above its starting point at [latex]t = 1 . \text{00}[/latex] s, since [latex]y_{1} > y_{0}[/latex]. It could be moving up or down; the only way to tell is to calculate [latex]v_{1}[/latex] and find out if it is positive or negative.
Solution for Velocity
[latex]v_{1}[/latex]
1. Identify the knowns. We know that [latex]y_{0} = 0[/latex]; [latex]v_{0} = \text{13} . \text{0 m}/\text{s}[/latex]; [latex]a = - g = - 9 . \text{80 m}/\text{s}^{2}[/latex]; and [latex]t = 1 . \text{00 s}[/latex]. We also know from the solution above that [latex]y_{1} = 8 . \text{10 m}[/latex].
2. Identify the best equation to use. The most straightforward is [latex]v = v_{0} - \text{gt}[/latex] (from [latex]v = v_{0} + \text{at}[/latex], where [latex]a = \text{gravitational acceleration} = - g[/latex]).
3. Plug in the knowns and solve. [latex]\begin{align*}v_{1} &= v_{0} - \text{gt} \\ &= \text{13} . \text{0 m}/\text{s} - \left(9 . \text{80 m}/\text{s}^{2}\right) \left(1 . \text{00 s}\right) \\ &= 3 . \text{20 m}/\text{s}\end{align*}[/latex]
Discussion
The positive value for [latex]v_{1}[/latex] means that the rock is still heading upward at [latex]t = 1 . \text{00} \text{s}[/latex]. However, it has slowed from its original 13.0 m/s, as expected.
Solution for Remaining Times
The procedures for calculating the position and velocity at [latex]t = 2 . \text{00} \text{s}[/latex] and [latex]3 . \text{00 s}[/latex] are the same as those above. The results are summarized in Table 2.1 and illustrated in Figure 2.39.
| Time, t | Position, y | Velocity, v | Acceleration, a |
|---|---|---|---|
| [latex]1 . \text{00 s}[/latex] | [latex]8 . \text{10 m}[/latex] | [latex]3 . \text{20 m}/\text{s}[/latex] | [latex]- 9 . \text{80 m}/\text{s}^{2}[/latex] |
| [latex]2 . \text{00 s}[/latex] | [latex]6 . \text{40 m}[/latex] | [latex]- 6 . \text{60 m}/\text{s}[/latex] | [latex]- 9 . \text{80 m}/\text{s}^{2}[/latex] |
| [latex]3 . \text{00 s}[/latex] | [latex]- 5 . \text{10 m}[/latex] | [latex]- \text{16} . \text{4 m}/\text{s}[/latex] | [latex]- 9 . \text{80 m}/\text{s}^{2}[/latex] |
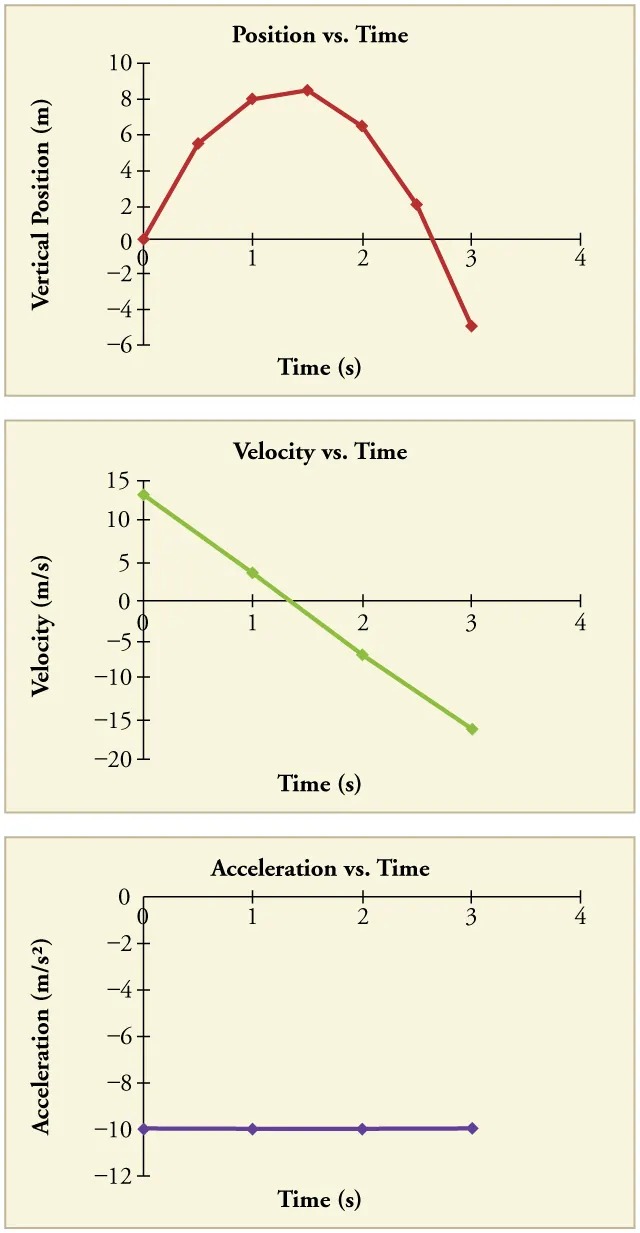
Figure 2.39 Vertical position, vertical velocity, and vertical acceleration vs. time for a rock thrown vertically up at the edge of a cliff. Notice that velocity changes linearly with time and that acceleration is constant. Misconception Alert! Notice that the position vs. time graph shows vertical position only. It is easy to get the impression that the graph shows some horizontal motion—the shape of the graph looks like the path of a projectile. But this is not the case; the horizontal axis is time, not space. The actual path of the rock in space is straight up, and straight down. Image from OpenStax College Physics 2e, CC-BY 4.0
Image Description
The image contains three separate graphs, each depicting a different aspect of motion over time. Below is a description of each graph:
1. Position vs. Time Graph
– The vertical axis represents vertical position in meters, ranging from -6 to 10.
– The horizontal axis represents time in seconds, ranging from 0 to 4.
– The graph shows a red curve starting at position 0 at time 0, peaking at approximately 9 meters at around 1.5 seconds, and then returning to 0 at around 3 seconds, before moving downwards to around -6 meters at 4 seconds.
2. Velocity vs. Time Graph
– The vertical axis represents velocity in meters per second (m/s), ranging from -20 to 15.
– The horizontal axis represents time in seconds, ranging from 0 to 4.
– The graph shows a green straight line descending from 15 m/s at 0 seconds, reaching 0 m/s at 3 seconds, and continuing to -15 m/s at 4 seconds.
3. Acceleration vs. Time Graph
– The vertical axis represents acceleration in meters per second squared (m/s²), ranging from -12 to 0.
– The horizontal axis represents time in seconds, ranging from 0 to 4.
– The graph shows a constant purple line at approximately -10 m/s² throughout the time period from 0 to 4 seconds.
These graphs illustrate an object in motion, with changes in its position, velocity, and constant acceleration over a span of 4 seconds.
Discussion
The interpretation of these results is important. At 1.00 s the rock is above its starting point and heading upward, since [latex]y_{1}[/latex] and [latex]v_{1}[/latex] are both positive. At 2.00 s, the rock is still above its starting point, but the negative velocity means it is moving downward. At 3.00 s, both [latex]y_{3}[/latex] and [latex]v_{3}[/latex] are negative, meaning the rock is below its starting point and continuing to move downward. Notice that when the rock is at its highest point (at 1.33 s), its velocity is zero, but its acceleration is still [latex]- 9 . \text{80 m}/\text{s}^{2}[/latex]. Its acceleration is [latex]- 9 . \text{80 m}/\text{s}^{2}[/latex] for the whole trip—while it is moving up and while it is moving down. Note that the values for [latex]y[/latex] are the positions (or displacements) of the rock, not the total distances traveled. Finally, note that free-fall applies to upward motion as well as downward. Both have the same acceleration—the acceleration due to gravity, which remains constant the entire time. Astronauts training in the famous Vomit Comet, for example, experience free-fall while arcing up as well as down, as we will discuss in more detail later.
Making Connections: Take-Home Experiment—Reaction Time
A simple experiment can be done to determine your reaction time. Have a friend hold a ruler between your thumb and index finger, separated by about 1 cm. Note the mark on the ruler that is right between your fingers. Have your friend drop the ruler unexpectedly, and try to catch it between your two fingers. Note the new reading on the ruler. Assuming acceleration is that due to gravity, calculate your reaction time. How far would you travel in a car (moving at 30 m/s) if the time it took your foot to go from the gas pedal to the brake was twice this reaction time?
Example 2.15
Calculating Velocity of a Falling Object: A Rock Thrown Down
What happens if the person on the cliff throws the rock straight down, instead of straight up? To explore this question, calculate the velocity of the rock when it is 5.10 m below the starting point, and has been thrown downward with an initial speed of 13.0 m/s.
Strategy
Draw a sketch.
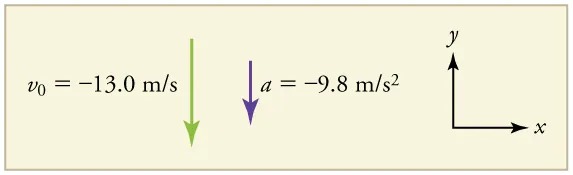
Figure 2.40 Image from OpenStax College Physics 2e, CC-BY 4.0
Image Description
The image depicts a physics problem involving motion. On the left, there are two equations:
- v0 = -13.0 m/s, with an accompanying green downward arrow, representing the initial velocity.
- a = -9.8 m/s2, with an accompanying purple downward arrow, representing the acceleration, likely due to gravity.
On the right side, there is a coordinate system with x and y axes. The y-axis points upward, and the x-axis points to the right. Since up is positive, the final position of the rock will be negative because it finishes below the starting point at [latex]y_{0} = 0[/latex]. Similarly, the initial velocity is downward and therefore negative, as is the acceleration due to gravity. We expect the final velocity to be negative since the rock will continue to move downward.
Solution
1. Identify the knowns. [latex]y_{0} = 0[/latex];
[latex]y_{1} = - 5 . \text{10 m}[/latex];
[latex]v_{0} = - \text{13} .\text{0 m}/\text{s}[/latex];
[latex]a = - g = - 9 . \text{80 m} /\text{s}^{2}[/latex].
2. Choose the kinematic equation that makes it easiest to solve the problem. The equation [latex]v^{2} = v_{0}^{2} + 2 a \left(\right. y - y_{0} \left.\right)[/latex] works well because the only unknown in it is [latex]v[/latex]. (We will plug [latex]y_{1}[/latex] in for [latex]y[/latex].)
3. Enter the known values
[latex]\begin{align*}v^{2} &= \left(- \text{13} . \text{0 m}/\text{s}\right)^{2} + 2 \left(- 9 . \text{80 m}/\text{s}^{2}\right) \left(- 5 . \text{10 m} - \text{0 m}\right) \\ &= \text{268} . \text{96 m}^{2} /\text{s}^{2} ,\end{align*}[/latex]
where we have retained extra significant figures because this is an intermediate result.
Taking the square root, and noting that a square root can be positive or negative, gives
[latex]v = \pm \text{16} .\text{4 m}/\text{s} .[/latex]
The negative root is chosen to indicate that the rock is still heading down. Thus,
[latex]v = - \text{16} .\text{4 m}/\text{s} .[/latex]
Discussion
Note that this is exactly the same velocity the rock had at this position when it was thrown straight upward with the same initial speed. (See Example 2.14 and Figure 2.41(a).) This is not a coincidental result. Because we only consider the acceleration due to gravity in this problem, the speed of a falling object depends only on its initial speed and its vertical position relative to the starting point. For example, if the velocity of the rock is calculated at a height of 8.10 m above the starting point (using the method from Example 2.14) when the initial velocity is 13.0 m/s straight up, a result of [latex]\pm 3 . \text{20 m}/\text{s}[/latex] is obtained. Here both signs are meaningful; the positive value occurs when the rock is at 8.10 m and heading up, and the negative value occurs when the rock is at 8.10 m and heading back down. It has the same speed but the opposite direction.
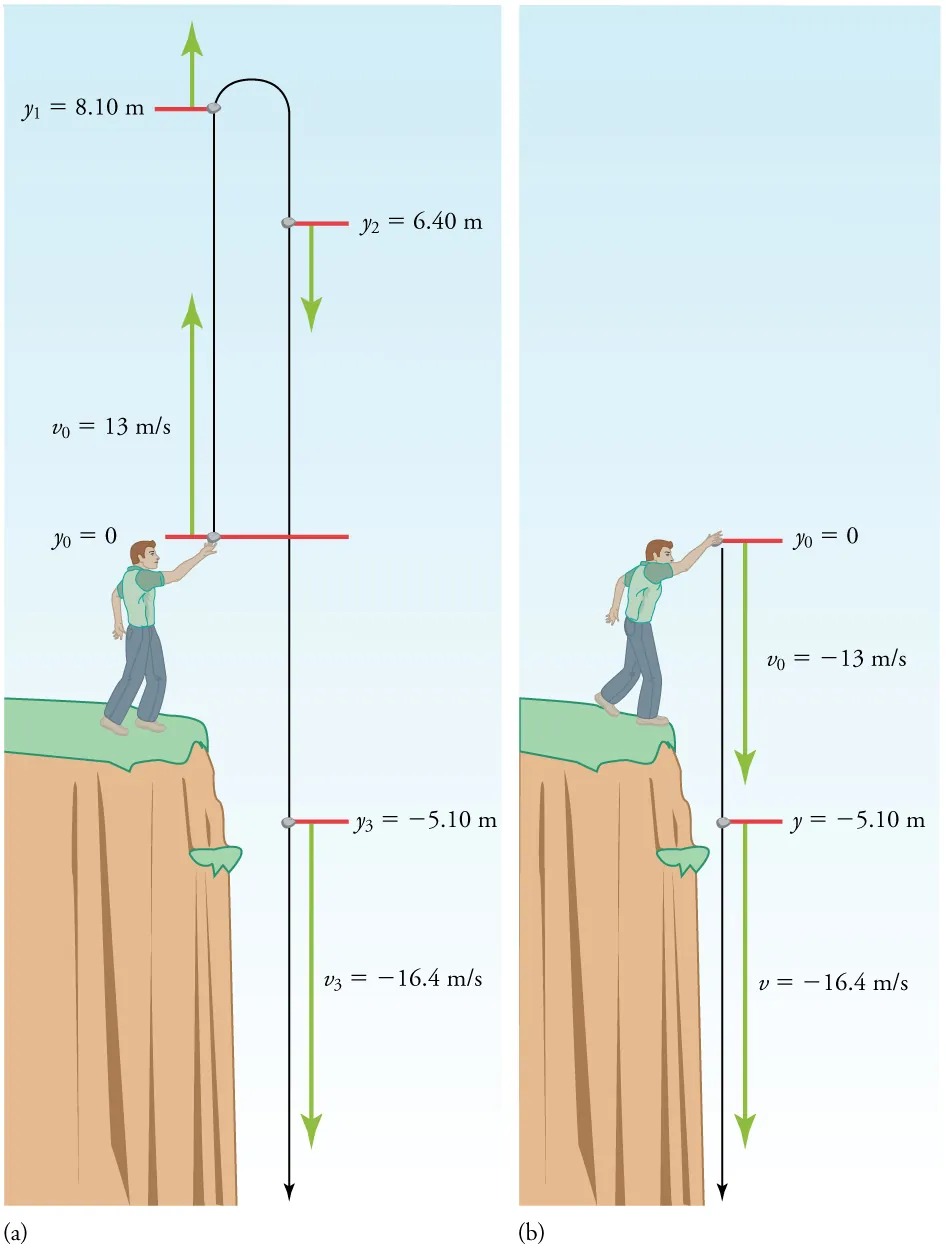
Figure 2.41 (a) A person throws a rock straight up, as explored in . The arrows are velocity vectors at 0, 1.00, 2.00, and 3.00 s. (b) A person throws a rock straight down from a cliff with the same initial speed as before, as in . Note that at the same distance below the point of release, the rock has the same velocity in both cases. Image from OpenStax College Physics 2e, CC-BY 4.0
Image Description
The image consists of two panels, labeled (a) and (b), depicting the motion of a ball thrown from the edge of a cliff. Both panels illustrate different scenarios of projectile motion.
Panel (a):
– A person stands at the edge of a cliff and throws a ball upwards.
– The ball follows a path that forms an arc, going upwards and then downwards.
– Initial position at the cliff edge is marked as \( y_0 = 0 \).
– The ball is thrown with an initial velocity \( v_0 = 13 \, \text{m/s} \) upwards.
– The highest point of the ball’s arc is labeled as \( y_1 = 8.10 \, \text{m} \).
– The ball descends to a height of \( y_2 = 6.40 \, \text{m} \) before continuing its downward trajectory.
– The ball reaches a point below the cliff at \( y_3 = -5.10 \, \text{m} \), with a velocity \( v_3 = -16.4 \, \text{m/s} \) downwards.
Panel (b):
– A person stands at the edge of the same cliff and throws a ball directly downwards.
– The initial position at the cliff edge is marked as \( y_0 = 0 \).
– The ball is thrown with an initial velocity \( v_0 = -13 \, \text{m/s} \) downwards.
– The ball continues its downward path directly reaching \( y = -5.10 \, \text{m} \), with a velocity \( v = -16.4 \, \text{m/s} \) downwards.
Both panels illustrate the concept of vertical motion with initial velocities and different trajectories. Arrow indicators show the direction of the ball’s motion, with annotations providing details about height and velocity.
Another way to look at it is this: In Example 2.14, the rock is thrown up with an initial velocity of [latex]\text{13} .\text{0 m}/\text{s}[/latex]. It rises and then falls back down. When its position is [latex]y = 0[/latex] on its way back down, its velocity is [latex]- \text{13} .\text{0 m}/\text{s}[/latex]. That is, it has the same speed on its way down as on its way up. We would then expect its velocity at a position of [latex]y = - 5 . \text{10 m}[/latex] to be the same whether we have thrown it upwards at [latex]+ \text{13} .\text{0 m}/\text{s}[/latex] or thrown it downwards at [latex]- \text{13} .\text{0 m}/\text{s}[/latex]. The velocity of the rock on its way down from [latex]y = 0[/latex] is the same whether we have thrown it up or down to start with, as long as the speed with which it was initially thrown is the same.
Example 2.16
Find g from Data on a Falling Object
The acceleration due to gravity on Earth differs slightly from place to place, depending on topography (e.g., whether you are on a hill or in a valley) and subsurface geology (whether there is dense rock like iron ore as opposed to light rock like salt beneath you.) The precise acceleration due to gravity can be calculated from data taken in an introductory physics laboratory course. An object, usually a metal ball for which air resistance is negligible, is dropped and the time it takes to fall a known distance is measured. See, for example, Figure 2.42. Very precise results can be produced with this method if sufficient care is taken in measuring the distance fallen and the elapsed time.
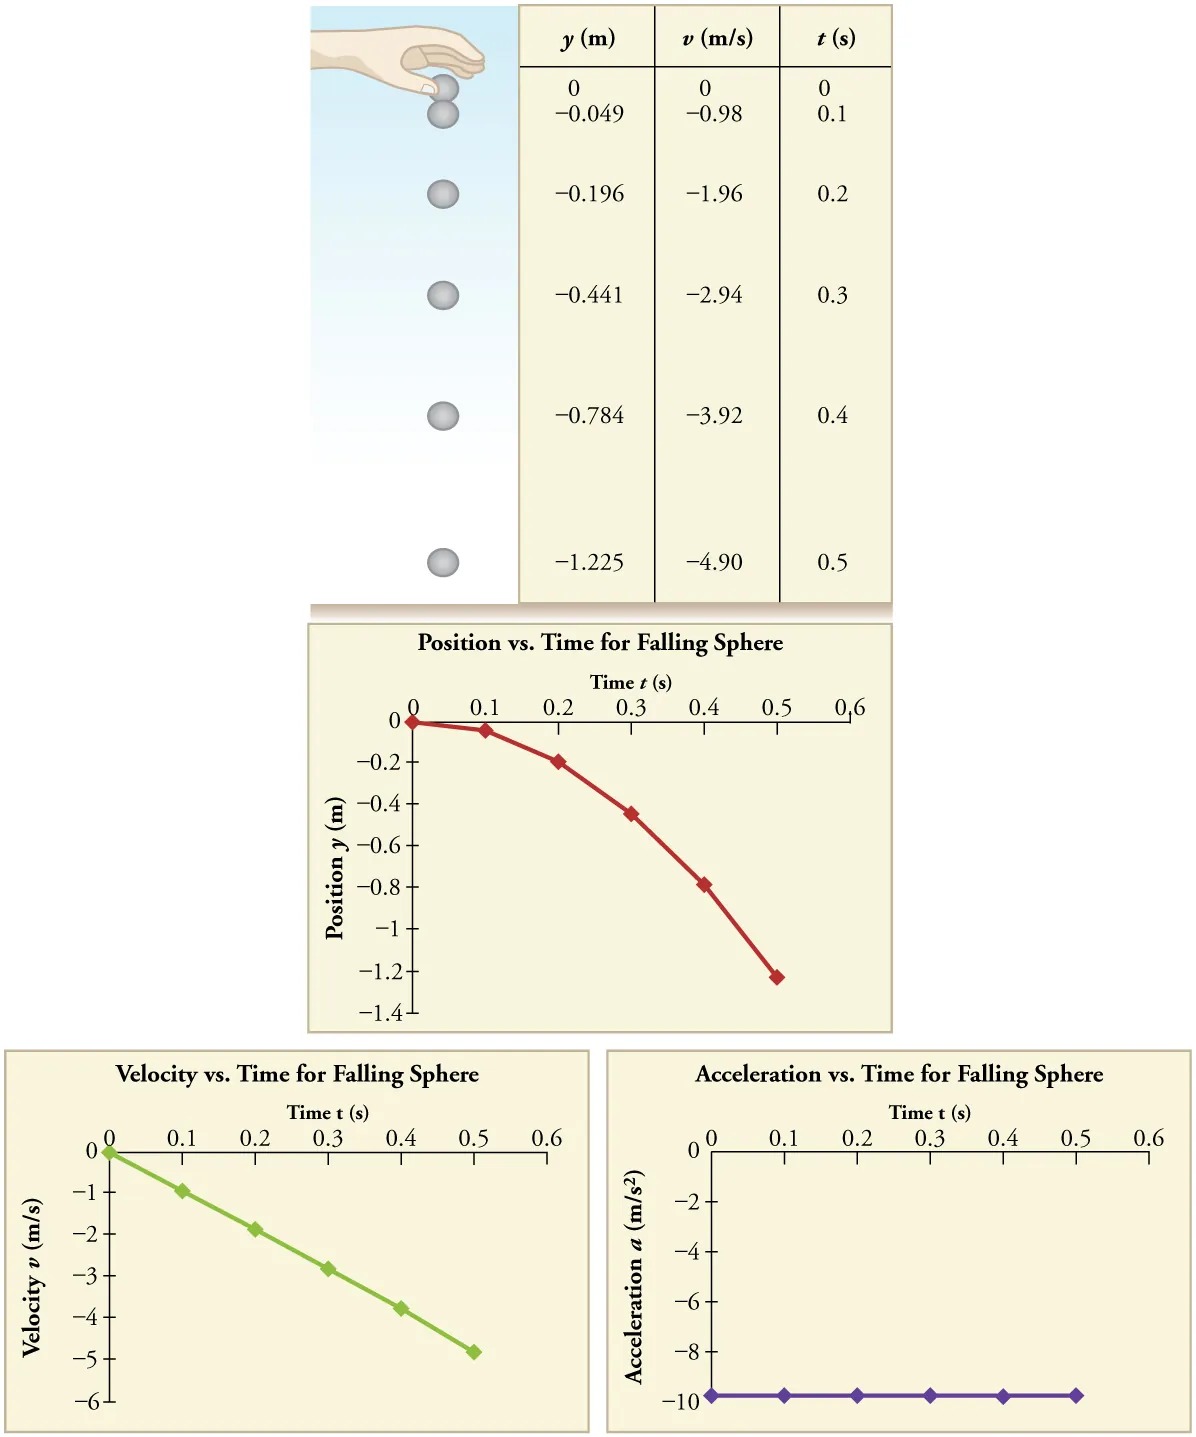
Figure 2.42 Positions and velocities of a metal ball released from rest when air resistance
is negligible. Velocity is seen to increase linearly with time while displacement increases
with time squared. Acceleration is a constant and is equal to gravitational acceleration. Image from OpenStax College Physics 2e, CC-BY 4.0
Image Description
The image consists of four parts: a diagram, a table, and three graphs.
1. Diagram:
– A hand is depicted holding and dropping a sphere, illustrating the motion of the sphere as it falls, shown in sequential downward positions.
2. Table:
– This table displays data of a falling sphere with three columns:
–
| y (m) | v (m/s) | t (s) |
|---|---|---|
| 0 | 0 | 0 |
| -0.049 | -0.98 | 0.1 |
| -0.196 | -1.96 | 0.2 |
| -0.441 | -2.94 | 0.3 |
| -0.784 | -3.92 | 0.4 |
| -1.225 | -4.90 | 0.5 |
3. Graphs:
– Position vs. Time for Falling Sphere:
– This graph has “Time t (s)” on the horizontal axis ranging from 0 to 0.6 seconds and “Position y (m)” on the vertical axis ranging from -1.4 to 0 meters. The graph shows a downward curve indicating the position of the sphere over time.
– Velocity vs. Time for Falling Sphere:
– This graph has “Time t (s)” on the horizontal axis and “Velocity v (m/s)” on the vertical axis ranging from -6 to 0 meters per second. The graph displays a linear downward trend, representing the increasing speed of the falling sphere.
– Acceleration vs. Time for Falling Sphere:
– This graph has “Time t (s)” on the horizontal axis and “Acceleration a (m/s²)” on the vertical axis ranging from -10 to 0 meters per second squared. It shows a horizontal line at -9.8, indicating constant acceleration due to gravity.
Suppose the ball falls 1.0000 m in 0.45173 s. Assuming the ball is not affected by air
resistance, what is the precise acceleration due to gravity at this location?
Strategy
Draw a sketch.
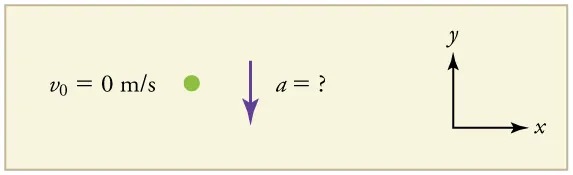
Figure 2.43 Image from OpenStax College Physics 2e, CC-BY 4.0
Image Description
The image contains a diagram with the following elements:
– On the left side, there is the text: “v₀ = 0 m/s,” indicating an initial velocity of zero meters per second.
– To the right of this text, there is a small green circle.
– A purple arrow points downward from the circle, with the text “a = ?” next to the arrow, questioning what the acceleration is.
– On the right side of the image, there is a coordinate system with ‘x’ and ‘y’ axes, where the ‘x’ axis points horizontally to the right and the ‘y’ axis points vertically upward.
The background of the image is a light, beige color. We need to solve for acceleration [latex]a[/latex]. Note that in this case, displacement is downward and therefore negative, as is acceleration.
Solution
1. Identify the knowns. [latex]y_{0} = 0[/latex];
[latex]y = –1 .\text{0000 m}[/latex];
[latex]t = 0 .\text{45173}[/latex]; [latex]v_{0} = 0[/latex].
2. Choose the equation that allows you to solve for [latex]a[/latex] using the known values.
[latex]y = y_{0} + v_{0} t + \frac{1}{2} \text{at}^{2}[/latex]
3. Substitute 0 for [latex]v_{0}[/latex] and rearrange the equation to solve for
[latex]a[/latex]. Substituting 0 for [latex]v_{0}[/latex] yields
[latex]y = y_{0} + \frac{1}{2} \text{at}^{2} .[/latex]
Solving for [latex]a[/latex] gives
[latex]a = \frac{2 \left(y - y_{0}\right)}{t^{2}} .[/latex]
4. Substitute known values yields
[latex]a = \frac{2 \left(\right. - 1 . \text{0000 m }–\text{ 0} \left.\right)}{\left(\right. 0 . \text{45173 s} \left.\right)^{2}} = - 9 . \text{8010 m}/\text{s}^{2} ,[/latex]
so, because [latex]a = - g[/latex] with the directions we have chosen,
[latex]g = 9 . \text{8010 m}/\text{s}^{2} .[/latex]
Discussion
The negative value for [latex]a[/latex] indicates that the gravitational acceleration is downward, as expected. We expect the value to be somewhere around the average value of [latex]9 . \text{80 m}/\text{s}^{2}[/latex], so [latex]9 . \text{8010 m}/\text{s}^{2}[/latex] makes sense. Since the data going into the calculation are relatively precise, this value for [latex]g[/latex] is more precise than the average value of [latex]9 . \text{80 m}/\text{s}^{2}[/latex]; it represents the local value for the acceleration due to gravity.
Check Your Understanding
A chunk of ice breaks off a glacier and falls 30.0 meters before it hits the water. Assuming it falls freely (there is no air resistance), how long does it take to hit the water?
Click for Solution
Solution
We know that initial position [latex]y_{0} = 0[/latex], final position [latex]y = −\text{30} . \text{0 m}[/latex], and [latex]a = - g = - 9 . \text{80 m}/\text{s}^{2}[/latex]. We can then use the equation [latex]y = y_{0} + v_{0} t + \frac{1}{2} \text{at}^{2}[/latex] to solve for [latex]t[/latex]. Inserting [latex]a = - g[/latex], we obtain
[latex]y & = & 0 + 0 - \frac{1}{2} \text{gt}^{2} \\ t^{2} & = & \frac{2 y}{- g} \\ t & = & \pm \sqrt{\frac{2 y}{- g}} = \pm \sqrt{\frac{2 \left(\right. - \text{30}.\text{0 m} \left.\right)}{- 9.80 m /\text{s}^{2}}} = \pm \sqrt{\text{6}.\text{12} s^{2}} = \text{2}.\text{47 s} \approx \text{2}.\text{5 s}[/latex]
where we take the positive value as the physically relevant answer. Thus, it takes about 2.5 seconds for the piece of ice to hit the water.
PhET Explorations
Equation Grapher
Learn about graphing polynomials. The shape of the curve changes as the constants are adjusted. View the curves for the individual terms (e.g. [latex]y = \text{bx}[/latex]) to see how they add to generate the polynomial curve.
