14.1 Sound
Learning Objectives
By the end of this section, you will be able to:
- Define sound and hearing.
- Describe sound as a longitudinal wave.
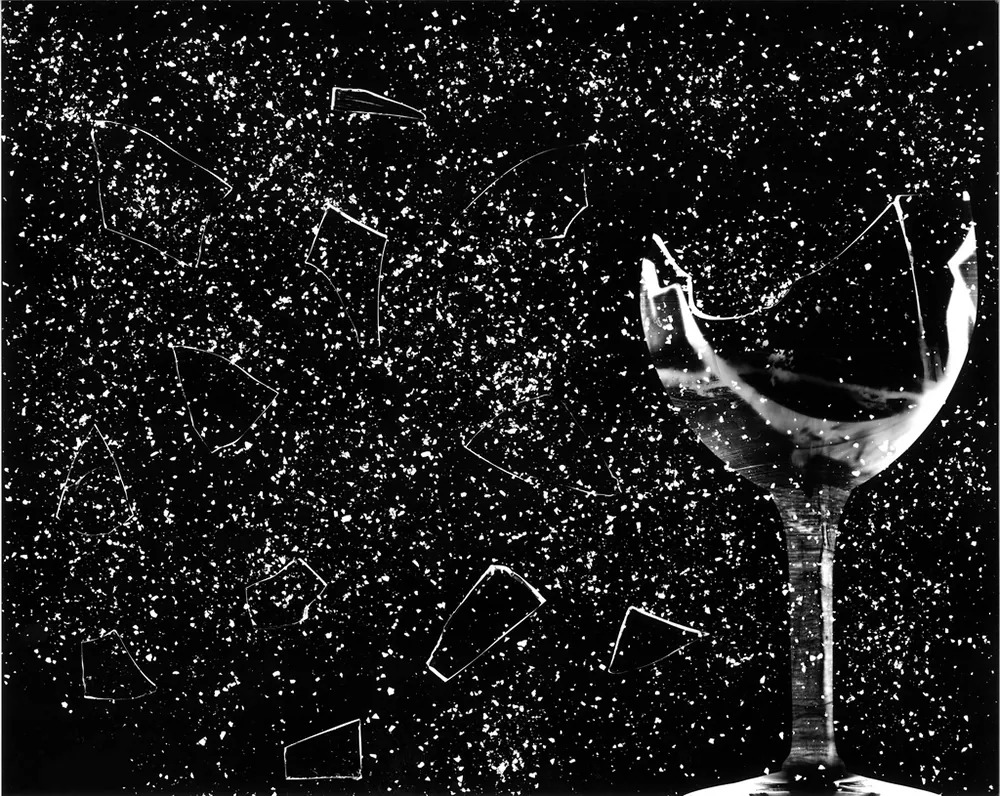
Figure 14.2 This glass has been shattered by a high-intensity sound wave of the same frequency as the resonant frequency of the glass. While the sound is not visible, the effects of the sound prove its existence. Image from OpenStax College Physics 2e, CC-BY 4.0
Sound can be used as a familiar illustration of waves. Because hearing is one of our most important senses, it is interesting to see how the physical properties of sound correspond to our perceptions of it. Hearing is the perception of sound, just as vision is the perception of visible light. But sound has important applications beyond hearing. Ultrasound, for example, is not heard but can be employed to form medical images and is also used in treatment.
The physical phenomenon of sound is defined to be a disturbance of matter that is transmitted from its source outward. Sound is a wave. On the atomic scale, it is a disturbance of atoms that is far more ordered than their thermal motions. In many instances, sound is a periodic wave, and the atoms undergo simple harmonic motion. In this text, we shall explore such periodic sound waves.
A vibrating string produces a sound wave as illustrated in Figure 14.3, Figure 14.4, and Figure 14.5. As the string oscillates back and forth, it transfers energy to the air, mostly as thermal energy created by turbulence. But a small part of the string’s energy goes into compressing and expanding the surrounding air, creating slightly higher and lower local pressures. These compressions (high pressure regions) and rarefactions (low pressure regions) move out as longitudinal pressure waves having the same frequency as the string—they are the disturbance that is a sound wave. (Sound waves in air and most fluids are longitudinal, because fluids have almost no shear strength. These are the sound waves we will study in this chapter. Although sound waves in solids can be both transverse and longitudinal, those are beyond the scope of our discussion.) Figure 14.5 shows a graph of gauge pressure versus distance from the vibrating string.
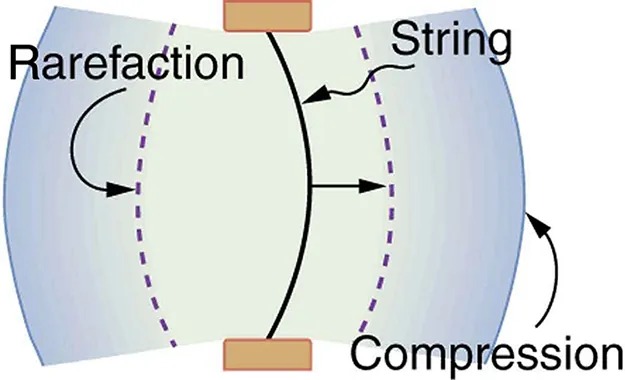
Figure 14.3 A vibrating string moving to the right compresses the air in front of it and expands the air behind it. Image from OpenStax College Physics 2e, CC-BY 4.0
Image Description
The image is a diagram illustrating the concepts of sound waves, focusing on rarefaction and compression. In the center, there is a straight black line labeled “String,” which represents the medium through which the wave travels, such as air or a string on a musical instrument. The string is flanked by two orange rectangles at the top and bottom, likely representing fixed points or sources of vibration.
To the left of the string, there is a section labeled “Rarefaction,” which is depicted with dashed purple lines curving outward, symbolizing areas where particles are spread apart.
On the right side of the string, the area is labeled “Compression,” shown with another set of dashed purple lines curving inward, indicating areas where particles are close together. Arrows point towards or away from the string in both rarefaction and compression areas to illustrate the movement of particles.
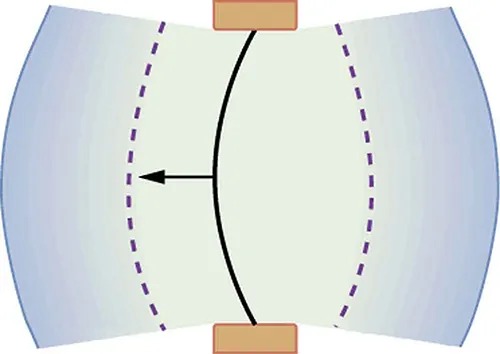
Figure 14.4 As the string moves to the left, it creates another compression and rarefaction as the ones on the right move away from the string. Image from OpenStax College Physics 2e, CC-BY 4.0
Image Description
The image depicts a diagram of a concave lens, illustrating the bending of light. It features two light blue curved surfaces, representing the lens, with orange-brown rectangles on the top and bottom, symbolizing the lens holders. A solid black arrow is shown entering from the center of the lens, curving towards the thicker part, indicative of light refracting. On either side of the central arrow, there are two dashed purple lines showing the original path of light before bending. The overall shape of the lens is concave, as demonstrated by the inward curve of its surfaces.
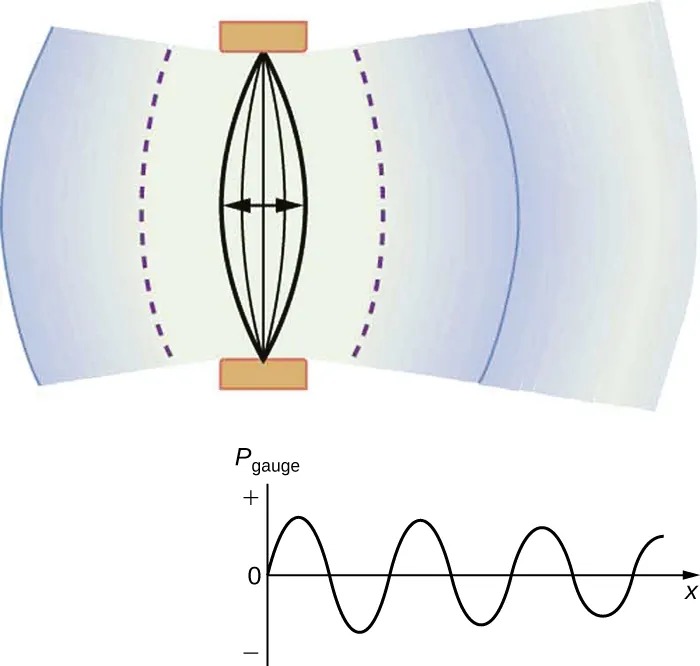
Figure 14.5 After many vibrations, there are a series of compressions and rarefactions moving out from the string as a sound wave. The graph shows gauge pressure versus distance from the source. Pressures vary only slightly from atmospheric for ordinary sounds. Image from OpenStax College Physics 2e, CC-BY 4.0
Image Description
The image consists of two main sections. The upper part illustrates an hourglass-shaped diagram with a central oval formed by multiple curved black lines that converge towards the ends of the oval. These lines are surrounded by a light blue shade. Curved arrows point inward from either side toward the center of the oval, and two horizontal beige rectangles are located at the top and bottom of the diagram. Additionally, there are two sets of dashed purple lines indicating the flow around the oval, with blue blurry edges giving a sense of movement or pressure.
The lower section contains a graph showing a sinusoidal wave. The horizontal axis, labeled “x,” represents the displacement, and the vertical axis labeled “Pgauge” represents pressure with positive, zero, and negative values. The wave oscillates above and below the central zero line.
The amplitude of a sound wave decreases with distance from its source, because the energy of the wave is spread over a larger and larger area. But it is also absorbed by objects, such as the eardrum in Figure 14.6, and converted to thermal energy by the viscosity of air. In addition, during each compression a little heat transfers to the air and during each rarefaction even less heat transfers from the air, so that the heat transfer reduces the organized disturbance into random thermal motions. Whether the heat transfer from compression to rarefaction is significant depends on how far apart they are—that is, it depends on wavelength. Wavelength, frequency, amplitude, and speed of propagation are important for sound, as they are for all waves.
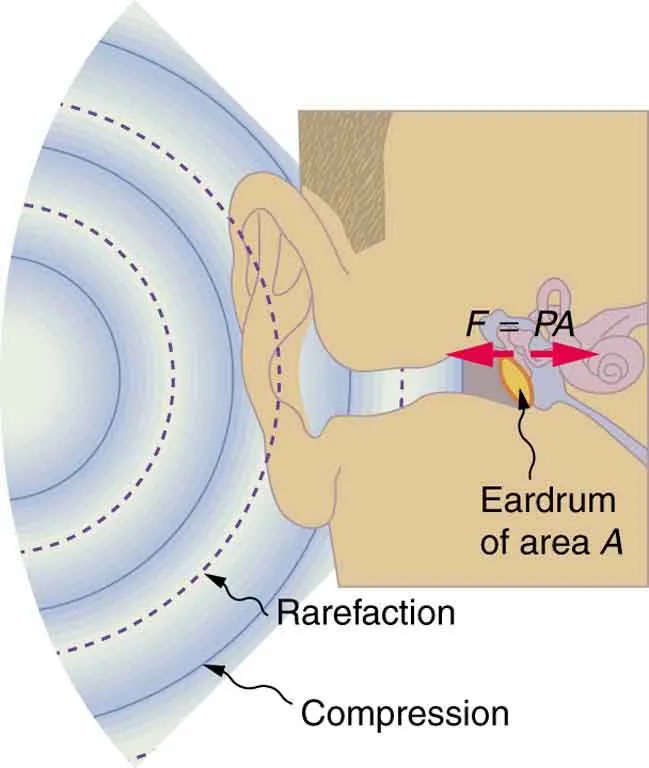
Figure 14.6 Sound wave compressions and rarefactions travel up the ear canal and force the eardrum to vibrate. There is a net force on the eardrum, since the sound wave pressures differ from the atmospheric pressure found behind the eardrum. A complicated mechanism converts the vibrations to nerve impulses, which are perceived by the person. Image from OpenStax College Physics 2e, CC-BY 4.0
Image Description
The image illustrates a cross-section of a human ear receiving sound waves. On the left side, concentric circles represent sound waves approaching the ear, with areas labeled “Compression” and “Rarefaction” showing the different phases of the sound wave. The right side depicts the anatomy of the ear, focusing on the eardrum. A close-up view shows an arrow labeled F = PA, indicating the force (F) on the eardrum is equal to the pressure (P) times the area (A). The eardrum is marked as “Eardrum of area A.” The sound waves are shown reaching the eardrum, demonstrating how they transmit sound energy into the ear.
PhET Explorations
Wave Interference
Make waves with a dripping faucet, audio speaker, or laser! Add a second source or a pair of slits to create an interference pattern.
