13.10 Superposition and Interference
Learning Objectives
By the end of this section, you will be able to:
- Explain standing waves.
- Describe the mathematical representation of overtones and beat frequency.

Most waves do not look very simple. They look more like the waves in Figure 13.32 than like the simple water wave considered in Waves. (Simple waves may be created by a simple harmonic oscillation, and thus have a sinusoidal shape). Complex waves are more interesting, even beautiful, but they look formidable. Most waves appear complex because they result from several simple waves adding together. Luckily, the rules for adding waves are quite simple.
When two or more waves arrive at the same point, they superimpose themselves on one another. More specifically, the disturbances of waves are superimposed when they come together—a phenomenon called superposition. Each disturbance corresponds to a force, and forces add. If the disturbances are along the same line, then the resulting wave is a simple addition of the disturbances of the individual waves—that is, their amplitudes add. Figure 13.33 and Figure 13.34 illustrate superposition in two special cases, both of which produce simple results.
Figure 13.33 shows two identical waves that arrive at the same point exactly in phase. The crests of the two waves are precisely aligned, as are the troughs. This superposition produces pure constructive interference. Because the disturbances add, pure constructive interference produces a wave that has twice the amplitude of the individual waves, but has the same wavelength.
Figure 13.34 shows two identical waves that arrive exactly out of phase—that is, precisely aligned crest to trough—producing pure destructive interference. Because the disturbances are in the opposite direction for this superposition, the resulting amplitude is zero for pure destructive interference—the waves completely cancel.
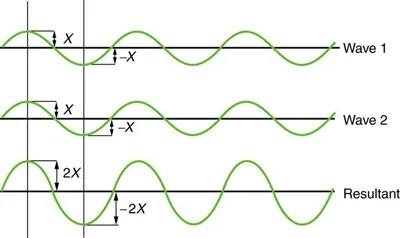
Figure 13.33 Pure constructive interference of two identical waves produces one with twice the amplitude, but the same wavelength. Image from OpenStax College Physics 2e, CC-BY 4.0
Image Description
The image shows three wave diagrams aligned vertically, each labeled accordingly:
- Wave 1: A sinusoidal wave is depicted in green, moving left to right. The wave oscillates above and below a central horizontal line. Two vertical lines intersect the wave, and distances marked as “X” and “-X” indicate the amplitude above and below the horizontal axis.
- Wave 2: Similar to Wave 1, this is another sinusoidal wave in green, with the same amplitude. It is slightly offset from Wave 1, beginning the first peak at the same point where Wave 1 begins its trough. Amplitudes are marked with the same “X” and “-X” labels as above.
- Resultant: The resultant wave is displayed below Waves 1 and 2. It shows the combined effect of the two waves, forming a wave with double the amplitude, marked as “2X” and “-2X”. This wave shows constructive interference, where peaks and troughs align to create a wave with larger amplitude.
The overall illustration demonstrates how two coherent waves with identical frequencies and amplitudes, when combined, can result in constructive interference to produce a new wave with greater amplitude.
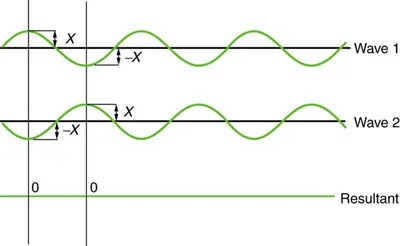
Figure 13.34 Pure destructive interference of two identical waves produces zero amplitude, or complete cancellation. Image from OpenStax College Physics 2e, CC-BY 4.0
Image Description
The image shows a diagram of two waves, labeled “Wave 1” and “Wave 2,” and their resulting combination, labeled “Resultant.” Both waves are sinusoidal, meaning they have a smooth, wave-like shape with peaks and troughs repeating at regular intervals.
Each wave is depicted with a horizontal line as the baseline. “Wave 1” is at the top and “Wave 2” is directly below it. The waves have the same amplitude and frequency, but they are out of phase. In “Wave 1,” a point on the wave labeled “X” is above the baseline, while in the corresponding position in “Wave 2,” labeled “-X,” the wave is below the baseline. Similarly, there are other points labeled with “X” and “-X” to show the symmetrical nature of the waves’ displacement about the baseline.
The “Resultant” wave is shown at the bottom of the diagram on a separate horizontal baseline. It appears as a straight line along the baseline because the two waves have opposite phases at the given points, meaning they cancel each other out completely.
While pure constructive and pure destructive interference do occur, they require precisely aligned identical waves. The superposition of most waves produces a combination of constructive and destructive interference and can vary from place to place and time to time. Sound from a stereo, for example, can be loud in one spot and quiet in another. Varying loudness means the sound waves add partially constructively and partially destructively at different locations. A stereo has at least two speakers creating sound waves, and waves can reflect from walls. All these waves superimpose. An example of sounds that vary over time from constructive to destructive is found in the combined whine of airplane jets heard by a stationary passenger. The combined sound can fluctuate up and down in volume as the sound from the two engines varies in time from constructive to destructive. These examples are of waves that are similar.
An example of the superposition of two dissimilar waves is shown in Figure 13.35. Here again, the disturbances add and subtract, producing a more complicated looking wave.
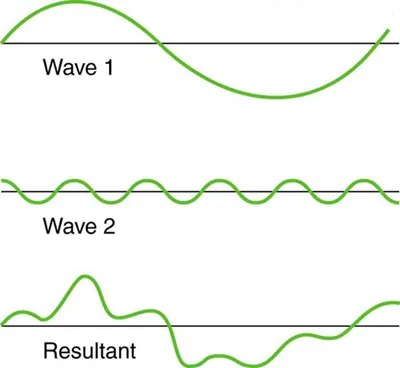
Figure 13.35 Superposition of non-identical waves exhibits both constructive and destructive interference. Image from OpenStax College Physics 2e, CC-BY 4.0
Image Description
The image displays three graphs depicting wave patterns. Each wave is represented by a green line oscillating along a black horizontal axis:
1. Wave 1: A smooth, large amplitude sinusoidal wave that evenly oscillates above and below the horizontal axis.
2. Wave 2: A smaller amplitude wave with more frequent oscillations, resulting in a wavy pattern with several peaks and troughs closely spaced on the axis.
3. Resultant: A combination of the patterns from Wave 1 and Wave 2. It creates a complex wave pattern that varies in amplitude and shows irregular oscillations due to the combination of the two previous waves.
Standing Waves
Sometimes waves do not seem to move; rather, they just vibrate in place. Unmoving waves can be seen on the surface of a glass of milk in a refrigerator, for example. Vibrations from the refrigerator motor create waves on the milk that oscillate up and down but do not seem to move across the surface. These waves are formed by the superposition of two or more moving waves, such as illustrated in Figure 13.36 for two identical waves moving in opposite directions. The waves move through each other with their disturbances adding as they go by. If the two waves have the same amplitude and wavelength, then they alternate between constructive and destructive interference. The resultant looks like a wave standing in place and, thus, is called a standing wave. Waves on the glass of milk are one example of standing waves. There are other standing waves, such as on guitar strings and in organ pipes. With the glass of milk, the two waves that produce standing waves may come from reflections from the side of the glass.
A closer look at earthquakes provides evidence for conditions appropriate for resonance, standing waves, and constructive and destructive interference. A building may be vibrated for several seconds with a driving frequency matching that of the natural frequency of vibration of the building—producing a resonance resulting in one building collapsing while neighboring buildings do not. Often buildings of a certain height are devastated while other taller buildings remain intact. The building height matches the condition for setting up a standing wave for that particular height. As the earthquake waves travel along the surface of Earth and reflect off denser rocks, constructive interference occurs at certain points. Often areas closer to the epicenter are not damaged while areas farther away are damaged.
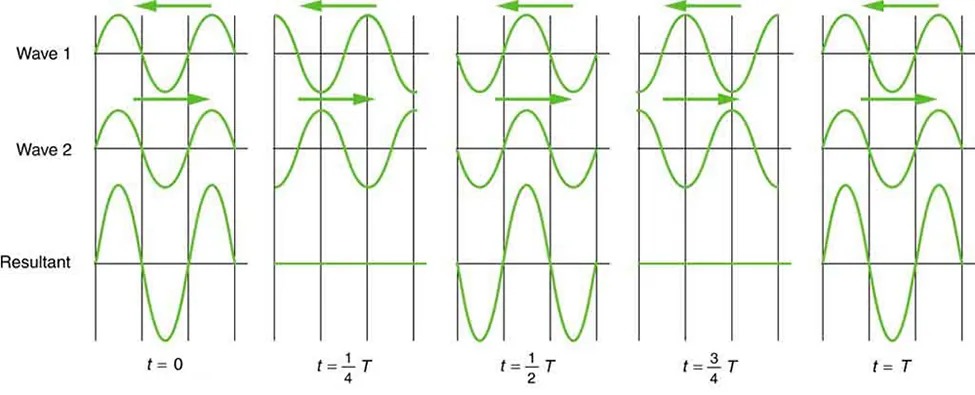
Figure 13.36 Standing wave created by the superposition of two identical waves moving in opposite directions. The oscillations are at fixed locations in space and result from alternately constructive and destructive interference. Image from OpenStax College Physics 2e, CC-BY 4.0
Image Description
The image shows the interference of two waves and their resultant over time. There are five columns, each representing different time intervals. Each column has three rows depicting Wave 1, Wave 2, and the Resultant wave. The waves are shown as sinusoidal curves.
| Time | Wave 1 | Wave 2 | Resultant |
|---|---|---|---|
| t = 0 | Sinusoidal wave moving left | Sinusoidal wave moving right | Wave pattern with reduced amplitude |
| t = 1/4 T | Sinusoidal wave moving left | Sinusoidal wave moving right | Wave pattern with increased amplitude |
| t = 1/2 T | Sinusoidal wave moving left | Sinusoidal wave moving right | Wave pattern with reduced amplitude |
| t = 3/4 T | Sinusoidal wave moving left | Sinusoidal wave moving right | Wave pattern with increased amplitude |
| t = T | Sinusoidal wave moving left | Sinusoidal wave moving right | Wave pattern with reduced amplitude |
Green arrows indicate the direction of wave movement. Wave 1 generally moves left while Wave 2 moves right. The resultant wave shows the combination of these two waves at each time interval.
Standing waves are also found on the strings of musical instruments and are due to reflections of waves from the ends of the string. Figure 13.37 and Figure 13.38 show three standing waves that can be created on a string that is fixed at both ends. Nodes are the points where the string does not move; more generally, nodes are where the wave disturbance is zero in a standing wave. The fixed ends of strings must be nodes, too, because the string cannot move there. The word antinode is used to denote the location of maximum amplitude in standing waves. Standing waves on strings have a frequency that is related to the propagation speed [latex]v_{\text{w}}[/latex] of the disturbance on the string. The wavelength [latex]\lambda[/latex] is determined by the distance between the points where the string is fixed in place.
The lowest frequency, called the fundamental frequency, is thus for the longest wavelength, which is seen to be [latex]\lambda_{1} = 2 L[/latex]. Therefore, the fundamental frequency is [latex]f_{1} = v_{\text{w}} / \lambda_{1} = v_{\text{w}} / 2 L[/latex]. In this case, the overtones or harmonics are multiples of the fundamental frequency. As seen in Figure 13.38, the first harmonic can easily be calculated since [latex]\lambda_{2} = L[/latex]. Thus, [latex]f_{2} = v_{\text{w}} / \lambda_{2} = v_{\text{w}} / 2 L = \left(2 f\right)_{1}[/latex]. Similarly, [latex]f_{3} = \left(3 f\right)_{1}[/latex], and so on. All of these frequencies can be changed by adjusting the tension in the string. The greater the tension, the greater [latex]v_{\text{w}}[/latex] is and the higher the frequencies. This observation is familiar to anyone who has ever observed a string instrument being tuned. We will see in later chapters that standing waves are crucial to many resonance phenomena, such as in sounding boxes on string instruments.
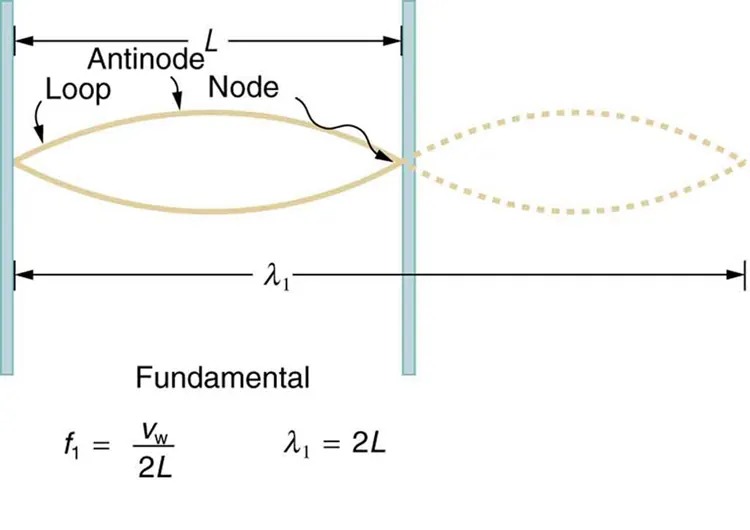
Figure 13.37 The figure shows a string oscillating at its fundamental frequency. Image from OpenStax College Physics 2e, CC-BY 4.0
Image Description
The image illustrates a fundamental mode of vibration on a string that is fixed at both ends. A horizontal line represents the string, with two vertical lines indicating rigid supports at the ends. The string shows one complete loop, indicating a standing wave.
– The left part of the wave is solid, while the right part is a faded extension, suggesting the continuation of the wave pattern.
– Labels are present:
– “Antinode” points to the middle of the loop where the amplitude is maximum.
– “Node” points to the ends of the loop where the displacement is zero.
– “Loop” refers to the entire visible wave pattern between two nodes.
– The distance between the nodes is marked as “L,” and the wavelength of the wave is shown as “λ₁ = 2L.”
– Additional text below reads:
– “Fundamental”
– The formula for the fundamental frequency: \( f_1 = \frac{v_w}{2L} \)
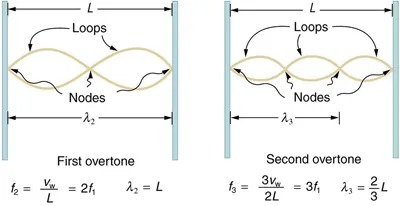
Figure 13.38 First and second overtones are shown. Image from OpenStax College Physics 2e, CC-BY 4.0
Image Description
The image shows two diagrams illustrating wave patterns for the first and second overtones in a resonating system, likely involving strings or air columns.
Left Diagram: First Overtone
- A standing wave with two loops and one node is depicted between two fixed points.
- The distance between the nodes is labeled as L.
- The wavelength is labeled as λ2 = L.
- Accompanying formula: f2 = vw/L = 2f1.
Right Diagram: Second Overtone
- A standing wave with three loops and two nodes is depicted between the same fixed points.
- The wavelength is labeled as λ3 = 2/3 L.
- Accompanying formula: f3 = 3vw/2L = 3f1.
Beats
Striking two adjacent keys on a piano produces a warbling combination usually considered to be unpleasant. The superposition of two waves of similar but not identical frequencies is the culprit. Another example is often noticeable in jet aircraft, particularly the two-engine variety, while taxiing. The combined sound of the engines goes up and down in loudness. This varying loudness happens because the sound waves have similar but not identical frequencies. The discordant warbling of the piano and the fluctuating loudness of the jet engine noise are both due to alternately constructive and destructive interference as the two waves go in and out of phase. Figure 16.39 illustrates this graphically.
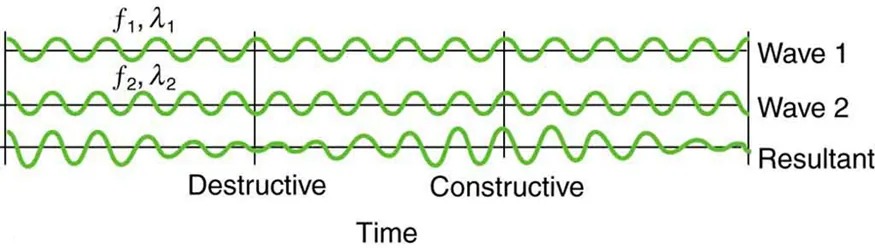
Figure 13.39 Beats are produced by the superposition of two waves of slightly different frequencies but identical amplitudes. The waves alternate in time between constructive interference and destructive interference, giving the resulting wave a time-varying amplitude. Image from OpenStax College Physics 2e, CC-BY 4.0
Image Description
The image is a diagram illustrating wave interference. It consists of three horizontal rows of waveforms, labeled as Wave 1, Wave 2, and Resultant on the right side.
- Wave 1 and Wave 2: Two separate waves are shown at the top. Each wave is labeled with frequency and wavelength symbols, f1, λ1 for Wave 1 and f2, λ2 for Wave 2. Both have a similar sinusoidal pattern, but may differ slightly in frequency or wavelength.
- Resultant: The third waveform shows the resulting wave from the interference of Wave 1 and Wave 2.
The diagram is divided into two sections by vertical lines, labeled as Destructive and Constructive interference. In the destructive interference section, the resultant wave has a reduced amplitude due to the out-of-phase interaction of Wave 1 and Wave 2. In the constructive interference section, the resultant wave has an increased amplitude due to the in-phase interaction of the two waves.
The horizontal axis is labeled as Time, suggesting that these changes occur over time.
The wave resulting from the superposition of two similar-frequency waves has a frequency that is the average of the two. This wave fluctuates in amplitude, or beats, with a frequency called the beat frequency. We can determine the beat frequency by adding two waves together mathematically. Note that a wave can be represented at one point in space as
[latex]x = X \text{cos} \left(\frac{2π t}{T}\right) = X \text{cos} \left(2π \text{ft}\right) ,[/latex]
where [latex]f = 1 / T[/latex] is the frequency of the wave. Adding two waves that have different frequencies but identical amplitudes produces a resultant
[latex]x = x_{1} + x_{2} .[/latex]
More specifically,
[latex]x = X \text{cos} \left(2π f_{1} t\right) + X \text{cos} \left(2π f_{2} t\right) .[/latex]
Using a trigonometric identity, it can be shown that
[latex]x = 2 X \text{cos} \left(\pi f_{\text{B}} t\right) \text{cos} \left(2π f_{\text{ave}} t\right) ,[/latex]
where
[latex]f_{B} = \mid f_{1} - f_{2} \mid[/latex]
is the beat frequency, and [latex]f_{\text{ave}}[/latex] is the average of [latex]f_{1}[/latex] and [latex]f_{2}[/latex]. These results mean that the resultant wave has twice the amplitude and the average frequency of the two superimposed waves, but it also fluctuates in overall amplitude at the beat frequency [latex]f_{\text{B}}[/latex]. The first cosine term in the expression effectively causes the amplitude to go up and down. The second cosine term is the wave with frequency [latex]f_{\text{ave}}[/latex]. This result is valid for all types of waves. However, if it is a sound wave, providing the two frequencies are similar, then what we hear is an average frequency that gets louder and softer (or warbles) at the beat frequency.
Making Career Connections
Piano tuners use beats routinely in their work. When comparing a note with a tuning fork, they listen for beats and adjust the string until the beats go away (to zero frequency). For example, if the tuning fork has a [latex]\text{256} \text{Hz}[/latex] frequency and two beats per second are heard, then the other frequency is either [latex]\text{254}[/latex] or [latex]\text{258} \text{Hz}[/latex]. Most keys hit multiple strings, and these strings are actually adjusted until they have nearly the same frequency and give a slow beat for richness. Twelve-string guitars and mandolins are also tuned using beats.
While beats may sometimes be annoying in audible sounds, we will find that beats have many applications. Observing beats is a very useful way to compare similar frequencies. There are applications of beats as apparently disparate as in ultrasonic imaging and radar speed traps.
Check Your Understanding
Imagine you are holding one end of a jump rope, and your friend holds the other. If your friend holds her end still, you can move your end up and down, creating a transverse wave. If your friend then begins to move her end up and down, generating a wave in the opposite direction, what resultant wave forms would you expect to see in the jump rope?
Click for Solution
Solution
The rope would alternate between having waves with amplitudes two times the original amplitude and reaching equilibrium with no amplitude at all. The wavelengths will result in both constructive and destructive interference
Check Your Understanding
Define nodes and antinodes.
Click for Solution
Solution
Nodes are areas of wave interference where there is no motion. Antinodes are areas of wave interference where the motion is at its maximum point.
Check Your Understanding
You hook up a stereo system. When you test the system, you notice that in one corner of the room, the sounds seem dull. In another area, the sounds seem excessively loud. Describe how the sound moving about the room could result in these effects.
Click for Solution
Solution
With multiple speakers putting out sounds into the room, and these sounds bouncing off walls, there is bound to be some wave interference. In the dull areas, the interference is probably mostly destructive. In the louder areas, the interference is probably mostly constructive.
PhET Explorations
Wave Interference
Make waves with a dripping faucet, audio speaker, or laser! Add a second source or a pair of slits to create an interference pattern.
