11.1 Temperature
Learning Objectives
By the end of this section, you will be able to:
- Define temperature.
- Convert temperatures between the Celsius, Fahrenheit, and Kelvin scales.
- Define thermal equilibrium.
- State the zeroth law of thermodynamics.
The concept of temperature has evolved from the common concepts of hot and cold. Human perception of what feels hot or cold is a relative one. For example, if you place one hand in hot water and the other in cold water, and then place both hands in tepid water, the tepid water will feel cool to the hand that was in hot water, and warm to the one that was in cold water. The scientific definition of temperature is less ambiguous than your senses of hot and cold. Temperature is operationally defined to be what we measure with a thermometer. (Many physical quantities are defined solely in terms of how they are measured. We shall see later how temperature is related to the kinetic energies of atoms and molecules, a more physical explanation.) Two accurate thermometers, one placed in hot water and the other in cold water, will show the hot water to have a higher temperature. If they are then placed in the tepid water, both will give identical readings (within measurement uncertainties). In this section, we discuss temperature, its measurement by thermometers, and its relationship to thermal equilibrium. Again, temperature is the quantity measured by a thermometer.
Misconception Alert: Human Perception vs. Reality
On a cold winter morning, a wooden bench feels warmer than a metal bench. Both benches are in thermal equilibrium with the outside air, and are thus the same temperature. They feel different because of the difference in the way that they conduct heat away from your skin. The metal conducts heat away from your body faster than the wood does (see more about conductivity in 12.5 Conduction). This is just one example demonstrating that the human sense of hot and cold is not determined by temperature alone.
Another factor that affects our perception of temperature is humidity. Most people feel much hotter on hot, humid days than on hot, dry days. This is because on humid days, sweat does not evaporate from the skin and in our lungs as efficiently as it does on dry days. It is the evaporation of sweat (or water from a sprinkler or pool) as well as water in the lungs that cools us off.
Any physical property that depends on temperature, and whose response to temperature is reproducible, can be used as the basis of a thermometer. Because many physical properties depend on temperature, the variety of thermometers is remarkable. For example, volume increases with temperature for most substances. This property is the basis for the common alcohol thermometer, the old mercury thermometer, and the bimetallic strip (Figure 11.4). Other properties used to measure temperature include electrical resistance and color, as shown in Figure 11.5, and the emission of infrared radiation, as shown in Figure 11.6.
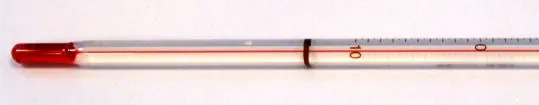
Figure 11.3 Alcohol thermometer with red dye. In a typical thermometer like this one, the alcohol, with a red dye, expands more rapidly than the glass containing it. When the thermometer’s temperature increases, the liquid from the bulb is forced into the narrow tube, producing a large change in the length of the column for a small change in temperature. Image from OpenStax College Physics 2e, CC-BY 4.0
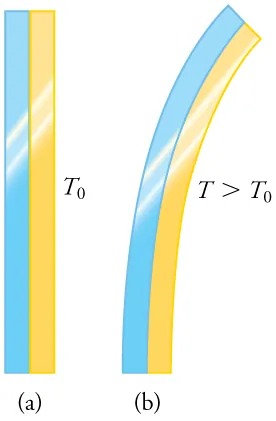
Figure 11.4 The curvature of a bimetallic strip depends on temperature. (a) The strip is straight at the starting temperature, where its two components have the same length. (b) At a higher temperature, this strip bends to the right, because the metal on the left has expanded more than the metal on the right. Image from OpenStax College Physics 2e, CC-BY 4.0
Image Description
The image consists of two side-by-side illustrations labeled (a) and (b).
– Illustration (a) shows two vertical strips, one blue and one yellow, placed side by side. They are straight and aligned vertically. The label “T₀” is placed next to these strips, indicating an initial temperature.
– Illustration (b) shows the same blue and yellow strips, but they are now curved to the right. The blue strip is on the outside of the curve, and the yellow strip is on the inside. The temperature label “T > T₀” suggests that the temperature has increased compared to illustration (a).
These illustrations demonstrate the bending of two materials when heated.
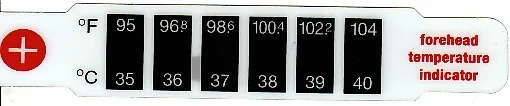
Figure 11.5 Each of the six squares on this plastic (liquid crystal) thermometer contains a film of a different heat-sensitive liquid crystal material. Below [latex]\text{95} º \text{F}[/latex], all six squares are black. When the plastic thermometer is exposed to temperature that increases to [latex]\text{95} º \text{F}[/latex], the first liquid crystal square changes color. When the temperature increases above [latex]\text{96} . 8 º \text{F}[/latex] the second liquid crystal square also changes color, and so forth. Image from OpenStax College Physics 2e, CC-BY 4.0
Image Description
The image is of a forehead temperature indicator strip. It is designed to display body temperature with a scale for both Fahrenheit and Celsius.
The strip features six black panels, each showing a temperature reading. To the left, there is a plus symbol in a red circle. Next to it, on the right, are columns of temperature readings. The numbers are white, printed on black rectangles. Each panel has two numbers: one in Fahrenheit (°F) and one in Celsius (°C).
The numbers from left to right are as follows:
| °F | 95 | 96.8 | 98.6 | 100.4 | 102.2 | 104 |
|---|---|---|---|---|---|---|
| °C | 35 | 36 | 37 | 38 | 39 | 40 |
On the right side of the strip, the text “forehead temperature indicator” is printed in red.

Temperature Scales
Thermometers are used to measure temperature according to well-defined scales of measurement, which use pre-defined reference points to help compare quantities. The three most common temperature scales are the Fahrenheit, Celsius, and Kelvin scales. A temperature scale can be created by identifying two easily reproducible temperatures. The freezing and boiling temperatures of water at standard atmospheric pressure are commonly used.
The Celsius scale (which replaced the slightly different centigrade scale) has the freezing point of water at [latex]0 º \text{C}[/latex] and the boiling point at [latex]\text{100} º \text{C}[/latex]. Its unit is the degree Celsius[latex]\left(\right. º \text{C} \left.\right)[/latex]. On the Fahrenheit scale (still the most frequently used in the United States), the freezing point of water is at [latex]\text{32} º \text{F}[/latex] and the boiling point is at [latex]\text{212} º \text{F}[/latex]. The unit of temperature on this scale is the degree Fahrenheit[latex]\left(\right. º \text{F} \left.\right)[/latex]. Note that a temperature difference of one degree Celsius is greater than a temperature difference of one degree Fahrenheit. Only 100 Celsius degrees span the same range as 180 Fahrenheit degrees, thus one degree on the Celsius scale is 1.8 times larger than one degree on the Fahrenheit scale [latex]\text{180} / \text{100} = 9 / 5 .[/latex]
The Kelvin scale is the temperature scale that is commonly used in science. It is an absolute temperature scale defined to have 0 K at the lowest possible temperature, called absolute zero. The official temperature unit on this scale is the kelvin, which is abbreviated K, and is not accompanied by a degree sign. The freezing and boiling points of water are 273.15 K and 373.15 K, respectively. Thus, the magnitude of temperature differences is the same in units of kelvins and degrees Celsius. Unlike other temperature scales, the Kelvin scale is an absolute scale. It is used extensively in scientific work because a number of physical quantities, such as the volume of an ideal gas, are directly related to absolute temperature. The kelvin is the SI unit used in scientific work.
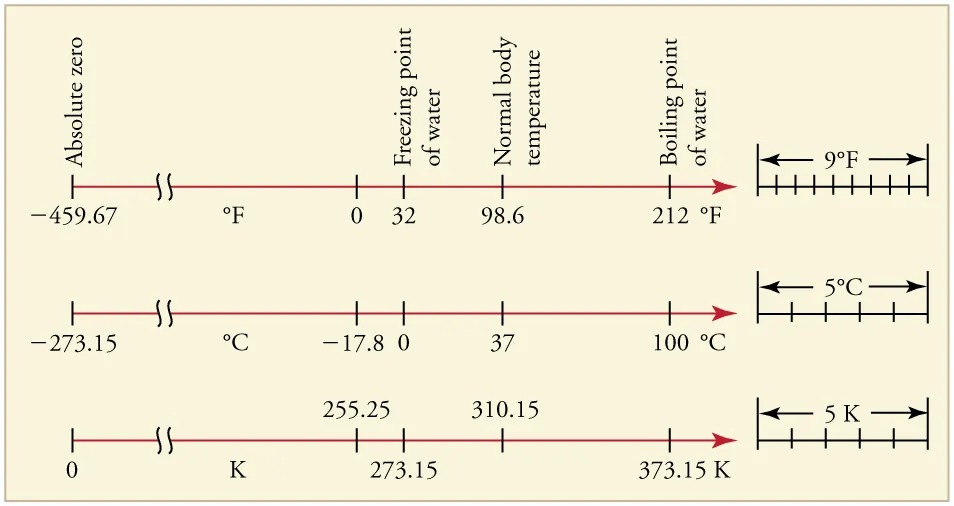
Figure 11.7 Relationships between the Fahrenheit, Celsius, and Kelvin temperature scales, rounded to the nearest degree. The relative sizes of the scales are also shown. Image from OpenStax College Physics 2e, CC-BY 4.0
Image Description
The image presents three horizontal temperature scales for Fahrenheit, Celsius, and Kelvin, starting from absolute zero and highlighting key temperature points.
The first scale is in Fahrenheit:
- Absolute zero: -459.67 °F
- Freezing point of water: 32 °F
- Normal body temperature: 98.6 °F
- Boiling point of water: 212 °F
The interval on the right shows a difference of 9 °F.
The second scale is in Celsius:
- Absolute zero: -273.15 °C
- Freezing point of water: 0 °C
- Normal body temperature: 37 °C
- Boiling point of water: 100 °C
The interval on the right shows a difference of 5 °C.
The third scale is in Kelvin:
- Absolute zero: 0 K
- Freezing point of water: 273.15 K
- Normal body temperature: 310.15 K
- Boiling point of water: 373.15 K
The interval on the right shows a difference of 5 K.
The relationships between the three common temperature scales is shown in Figure 11.7. Temperatures on these scales can be converted using the equations in Table 11.1.
| To convert from . . . | Use this equation . . . | Also written as . . . |
|---|---|---|
| Celsius to Fahrenheit | [latex]T \left(º \text{F}\right) = \frac{9}{5} T \left(º \text{C}\right) + \text{32}[/latex] | [latex]T_{º \text{F}} = \frac{9}{5} T_{º \text{C}} + \text{32}[/latex] |
| Fahrenheit to Celsius | [latex]T \left(º \text{C}\right) = \frac{5}{9} \left(T \left(º \text{F}\right) - \text{32}\right)[/latex] | [latex]T_{º \text{C}} = \frac{5}{9} \left(T_{º \text{F}} - \text{32}\right)[/latex] |
| Celsius to Kelvin | [latex]T \left(\text{K}\right) = T \left(º \text{C}\right) + \text{273} . \text{15}[/latex] | [latex]T_{\text{K}} = T_{º \text{C}} + \text{273} . \text{15}[/latex] |
| Kelvin to Celsius | [latex]T \left(º \text{C}\right) = T \left(\text{K}\right) - \text{273} . \text{15}[/latex] | [latex]T_{º \text{C}} = T_{\text{K}} - \text{273} . \text{15}[/latex] |
| Fahrenheit to Kelvin | [latex]T \left(\text{K}\right) = \frac{5}{9} \left(T \left(º \text{F}\right) - \text{32}\right) + \text{273} . \text{15}[/latex] | [latex]T_{\text{K}} = \frac{5}{9} \left(T_{º \text{F}} - \text{32}\right) + \text{273} . \text{15}[/latex] |
| Kelvin to Fahrenheit | [latex]T \left(\right. º \text{F} \left.\right) = \frac{9}{5} \left(T \left(\text{K}\right) - \text{273} . \text{15}\right) + \text{32}[/latex] | [latex]T_{º \text{F}} = \frac{9}{5} \left(T_{\text{K}} - \text{273} . \text{15}\right) + \text{32}[/latex] |
Example 11.1
Converting between Temperature Scales: Room Temperature
“Room temperature” is generally defined to be [latex]\text{25} º \text{C}[/latex]. (a) What is room temperature in [latex]º \text{F}[/latex]? (b) What is it in K?
Strategy
To answer these questions, all we need to do is choose the correct conversion equations and plug in the known values.
Solution for (a)
1. Choose the right equation. To convert from [latex]º \text{C}[/latex] to [latex]º \text{F}[/latex], use the equation
[latex]T_{º \text{F}} = \frac{9}{5} T_{º \text{C}} + \text{32} .[/latex]
2. Plug the known value into the equation and solve:
[latex]T_{º \text{F}} = \frac{9}{5} \text{25} º \text{C} + \text{32} = \text{77} º \text{F} .[/latex]
Solution for (b)
1. Choose the right equation. To convert from [latex]º \text{C}[/latex] to K, use the equation
[latex]T_{\text{K}} = T_{º \text{C}} + \text{273} . \text{15} .[/latex]
2. Plug the known value into the equation and solve:
[latex]T_{\text{K}} = \text{25} º \text{C} + \text{273} . \text{15} = \text{298} \text{K} .[/latex]
Example 11.2
Converting between Temperature Scales: the Reaumur Scale
The Reaumur scale is a temperature scale that was used widely in Europe in the 18th and 19th centuries. On the Reaumur temperature scale, the freezing point of water is [latex]0 º \text{R}[/latex] and the boiling temperature is [latex]\text{80} º \text{R}[/latex]. If “room temperature” is [latex]\text{25} º \text{C}[/latex] on the Celsius scale, what is it on the Reaumur scale?
Strategy
To answer this question, we must compare the Reaumur scale to the Celsius scale. The difference between the freezing point and boiling point of water on the Reaumur scale is [latex]\text{80} º \text{R}[/latex]. On the Celsius scale it is [latex]\text{100} º \text{C}[/latex]. Therefore [latex]\text{100} º \text{C} = \text{80} º \text{R}[/latex]. Both scales start at [latex]0 º[/latex] for freezing, so we can derive a simple formula to convert between temperatures on the two scales.
Solution
1. Derive a formula to convert from one scale to the other:
[latex]T_{º \text{R}} = \frac{0 . 8 º \text{R}}{º \text{C}} \times T_{º \text{C}} .[/latex]
2. Plug the known value into the equation and solve:
[latex]T_{º \text{R}} = \frac{0 . 8 º \text{R}}{º \text{C}} \times \text{25} º \text{C} = \text{20} º \text{R} .[/latex]
Temperature Ranges in the Universe
Figure 11.9 shows the wide range of temperatures found in the universe. Human beings have been known to survive with body temperatures within a small range, from [latex]\text{24} º \text{C}[/latex] to [latex]\text{44} º \text{C}[/latex] [latex]\left(\right. \text{75} º \text{F}[/latex] to [latex]\text{111} º \text{F}[/latex]). The average normal body temperature is usually given as [latex]\text{37} . 0 º \text{C}[/latex] ([latex]\text{98} . 6 º \text{F}[/latex]), and variations in this temperature can indicate a medical condition: a fever, an infection, a tumor, or circulatory problems (see Figure 11.8).
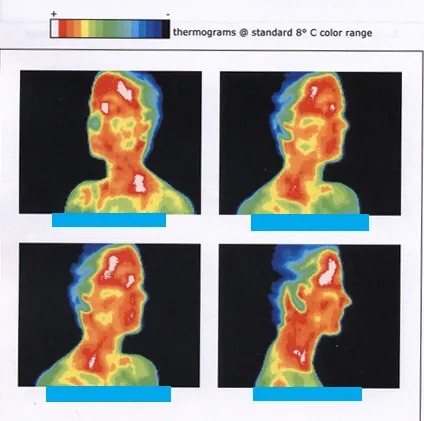
Figure 11.8 This image of radiation from a person’s body (an infrared thermograph) shows the location of temperature abnormalities in the upper body. Dark blue corresponds to cold areas and red to white corresponds to hot areas. An elevated temperature might be an indication of malignant tissue (a cancerous tumor in the breast, for example), while a depressed temperature might be due to a decline in blood flow from a clot. In this case, the abnormalities are caused by a condition called hyperhidrosis. Image from OpenStax College Physics 2e, CC-BY 4.0
The lowest temperatures ever recorded have been measured during laboratory experiments: [latex]4 . 5 \times \text{10}^{– \text{10}} \text{ K}[/latex] at the Massachusetts Institute of Technology (USA), and [latex]1 . 0 \times \text{10}^{– \text{10}} \text{ K}[/latex] at Helsinki University of Technology (Finland). In comparison, the coldest recorded place on Earth’s surface is Vostok, Antarctica at 183 K [latex]\left(\right. – \text{89} º \text{C} \left.\right)[/latex], and the coldest place (outside the lab) known in the universe is the Boomerang Nebula, with a temperature of 1 K.
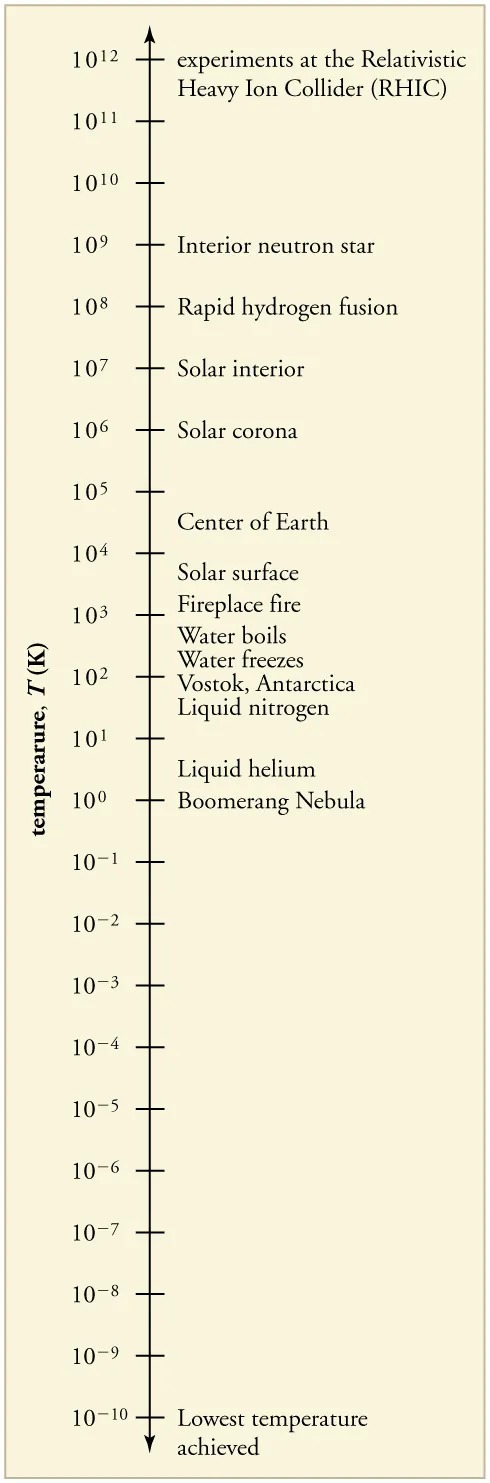
Figure 11.9 Each increment on this logarithmic scale indicates an increase by a factor of ten, and thus illustrates the tremendous range of temperatures in nature. Note that zero on a logarithmic scale would occur off the bottom of the page at infinity. Image from OpenStax College Physics 2e, CC-BY 4.0
Image Description
The image is a vertical scale representing a range of temperatures measured in Kelvin (K), with various phenomena or locations associated with each temperature level. The scale ranges from 1012 K at the top to 10-10 K at the bottom. Below is an HTML table representing the information from the scale:
| Temperature (K) | Phenomenon/Location |
|---|---|
| 1012 | Experiments at the Relativistic Heavy Ion Collider (RHIC) |
| 1011 | |
| 1010 | |
| 109 | Interior neutron star |
| 108 | Rapid hydrogen fusion |
| 107 | Solar interior |
| 106 | Solar corona |
| 105 | |
| 104 | Center of Earth |
| 103 | Solar surface, Fireplace fire |
| 102 | Water boils, Water freezes, Vostok, Antarctica |
| 101 | Liquid nitrogen |
| 100 | Liquid helium, Boomerang Nebula |
| 10-1 | |
| 10-2 | |
| 10-3 | |
| 10-4 | |
| 10-5 | |
| 10-6 | |
| 10-7 | |
| 10-8 | |
| 10-9 | |
| 10-10 | Lowest temperature achieved |
Making Connections: Absolute Zero
What is absolute zero? The concept of absolute zero arises from the behavior of gases. Figure 11.10 shows how the pressure of gases at a constant volume decreases as temperature decreases. Various scientists have noted that the pressures of gases extrapolate to zero at the same temperature, [latex]– \text{273} . \text{15} º \text{C}[/latex]. This extrapolation suggests that there is a lowest temperature. Other thermodynamic relationships lead to the same conclusion. This lowest temperature is called absolute zero. At absolute zero, molecular motion is at the minimum energy possible. Today we know that most gases first liquefy and then freeze, and it is not actually possible to reach absolute zero. The numerical value of absolute zero temperature is [latex]– \text{273} . \text{15} º \text{C}[/latex] or 0 K.
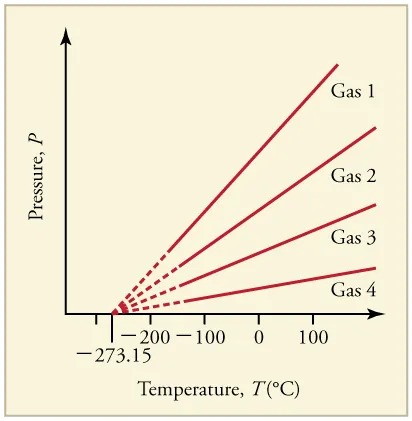
Figure 11.10 Graph of pressure versus temperature for various gases kept at a constant volume. Note that all of the graphs extrapolate to zero pressure at the same temperature. Image from OpenStax College Physics 2e, CC-BY 4.0
Image Description
The image is a graph that illustrates the relationship between pressure and temperature for four different gases. The x-axis is labeled “Temperature, T (°C)” and ranges from approximately -273.15°C to 100°C. The y-axis is labeled “Pressure, P” and indicates increasing pressure but does not have specific values marked.
Four lines representing different gases are plotted on the graph:
- Gas 1: The line is the farthest to the right, indicating a steeper increase in pressure with temperature compared to the other gases.
- Gas 2: The line is slightly less steep than Gas 1.
- Gas 3: The line is even less steep, indicating a moderate increase in pressure with temperature.
- Gas 4: The line is the least steep, indicating the least change in pressure with temperature among the four gases.
The lines extend from near the bottom left corner, with all of them converging towards the y-axis as the temperature approaches -273.15°C.
Thermal Equilibrium and the Zeroth Law of Thermodynamics
Thermometers actually take their own temperature, not the temperature of the object they are measuring. This raises the question of how we can be certain that a thermometer measures the temperature of the object with which it is in contact. It is based on the fact that any two systems placed in thermal contact (meaning heat transfer can occur between them) but isolated from the rest of the environment, will reach the same temperature. That is, heat will flow from the hotter object to the cooler one until they have exactly the same temperature. The objects are then in thermal equilibrium, and no further heat flow or changes in temperature will occur. Thus, if enough time is allowed for this transfer of heat to run its course, the temperature a thermometer registers does represent the system with which it is in thermal equilibrium. Thermal equilibrium is established when two bodies are in contact with each other and can freely exchange energy. A single object is said to be in internal thermal equilibrium when no heat is flowing within the object and therefore its temperature is uniform.
Furthermore, experimentation has shown that if two systems, A and B, are in thermal equilibrium with each another, and B is in thermal equilibrium with a third system C, then A is also in thermal equilibrium with C. This conclusion may seem obvious, because all three have the same temperature, but it is basic to thermodynamics. It is called the zeroth law of thermodynamics.
The Zeroth Law of Thermodynamics
If two systems, A and B, are in thermal equilibrium with each other, and B is in thermal equilibrium with a third system, C, then A is also in thermal equilibrium with C.
This law was postulated in the 1930s, after the first and second laws of thermodynamics had been developed and named. It is called the zeroth law because it comes logically before the first and second laws of thermodynamics. Suppose, for example, a cold metal block and a hot metal block are both placed on a metal plate at room temperature. Eventually the cold block and the plate will be in thermal equilibrium. In addition, the hot block and the plate will be in thermal equilibrium. By the zeroth law, we can conclude that the cold block and the hot block are also in thermal equilibrium. Similarly, two thermometers placed in thermal contact, one with one block and the second with the other block, will also be in thermal equilibrium and therefore read the same temperature. This establishes temperature as a meaningful concept.
Check Your Understanding
Does the temperature of a body in internal thermal equilibrium depend on its size?
Click for Solution
Solution
No, the system can be divided into smaller parts. Since no heat is flowing, each part is in equilibrium with the adjacent part, and according to the zeroth law, this means all parts are in equilibrium with each other and are at the same temperature. Quantities that are independent of size are called intensive quantities. Temperature is an intensive quantity.
