Problems & Exercises
Problems & Exercises
2.1 Displacement
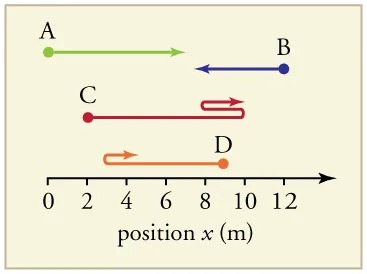
Figure 2.57 Image from OpenStax College Physics 2e, CC-BY 4.0
Image Description
The image is a diagram illustrating the movements of four objects, labeled A, B, C, and D, along a horizontal axis, which represents position \(x\) in meters.
– Object A: Represented by a green line with an arrow pointing right, starting at a position slightly greater than 0 meters and ending near 4 meters.
– Object B: Represented by a blue line with an arrow pointing left, starting near 7 meters and ending around 11 meters.
– Object C: Represented by a red line with a loop in the middle. It starts near 3 meters, loops back around 5 meters, and ends around 9 meters.
– Object D: Represented by an orange line with an arrow pointing right, starting near 2 meters and ending around 8 meters.
Below these lines, there’s a horizontal axis marked from 0 to 12 meters, labeled as “position \(x\) (m).” An arrow at the end of the axis indicates increasing direction to the right.
- Find the following for path A in Figure 2.57: (a) The distance traveled. (b) The magnitude of the displacement from start to finish. (c) The displacement from start to finish.
- Find the following for path B in Figure 2.57: (a) The distance traveled. (b) The magnitude of the displacement from start to finish. (c) The displacement from start to finish.
- Find the following for path C in Figure 2.57: (a) The distance traveled. (b) The magnitude of the displacement from start to finish. (c) The displacement from start to finish.
- Find the following for path D in Figure 2.57: (a) The distance traveled. (b) The magnitude of the displacement from start to finish. (c) The displacement from start to finish.
2.3 Time, Velocity, and Speed
- (a) Calculate Earth’s average speed relative to the Sun. (b) What is its average velocity over a period of one year?
- A helicopter blade spins at exactly 100 revolutions per minute. Its tip is 5.00 m from the center of rotation. (a) Calculate the average speed of the blade tip in the helicopter’s frame of reference. (b) What is its average velocity over one revolution?
- The North American and European continents are moving apart at a rate of about 3 cm/y. At this rate how long will it take them to drift 500 km farther apart than they are at present?
- Land west of the San Andreas fault in southern California is moving at an average velocity of about 6 cm/y northwest relative to land east of the fault. Los Angeles is west of the fault and may thus someday be at the same latitude as San Francisco, which is east of the fault. How far in the future will this occur if the displacement to be made is 590 km northwest, assuming the motion remains constant?
- On May 26, 1934, a streamlined, stainless steel diesel train called the Zephyr set the world’s nonstop long-distance speed record for trains. Its run from Denver to Chicago took 13 hours, 4 minutes, 58 seconds, and was witnessed by more than a million people along the route. The total distance traveled was 1633.8 km. What was its average speed in km/h and m/s?
- Tidal friction is slowing the rotation of the Earth. As a result, the orbit of the Moon is increasing in radius at a rate of approximately 4 cm/year. Assuming this to be a constant rate, how many years will pass before the radius of the Moon’s orbit increases by [latex]3 . \text{84} \times \text{10}^{6} m[/latex] (1%)?
- A student drove to the university from their home and noted that the odometer reading of their car increased by 12.0 km. The trip took 18.0 min. (a) What was their average speed? (b) If the straight-line distance from their home to the university is 10.3 km in a direction [latex]\text{25} . 0º[/latex] south of east, what was their average velocity? (c) If they returned home by the same path 7 h 30 min after they left, what were their average speed and velocity for the entire trip?
- The speed of propagation of the action potential (an electrical signal) in a nerve cell depends (inversely) on the diameter of the axon (nerve fiber). If the nerve cell connecting the spinal cord to your feet is 1.1 m long, and the nerve impulse speed is 18 m/s, how long does it take for the nerve signal to travel this distance?
- Conversations with astronauts on the lunar surface were characterized by a kind of echo in which the earthbound person’s voice was so loud in the astronaut’s space helmet that it was picked up by the astronaut’s microphone and transmitted back to Earth. It is reasonable to assume that the echo time equals the time necessary for the radio wave to travel from the Earth to the Moon and back (that is, neglecting any time delays in the electronic equipment). Calculate the distance from Earth to the Moon given that the echo time was 2.56 s and that radio waves travel at the speed of light [latex]\left(\right. 3 . \text{00} \times \text{10}^{8} \text{ m}/\text{s} \left.\right)[/latex].
- A football quarterback runs 15.0 m straight down the playing field in 2.50 s. He is then hit and pushed 3.00 m straight backward in 1.75 s. He breaks the tackle and runs straight forward another 21.0 m in 5.20 s. Calculate his average velocity (a) for each of the three intervals and (b) for the entire motion.
- The planetary model of the atom pictures electrons orbiting the atomic nucleus much as planets orbit the Sun. In this model you can view hydrogen, the simplest atom, as having a single electron in a circular orbit [latex]1 . \text{06} \times \text{10}^{- \text{10}} \text{ m}[/latex] in diameter. (a) If the average speed of the electron in this orbit is known to be [latex]2 . \text{20} \times \text{10}^{6} \text{ m}/\text{s}[/latex], calculate the number of revolutions per second it makes about the nucleus. (b) What is the electron’s average velocity per revolution?
2.4 Acceleration
- A cheetah can accelerate from rest to a speed of 30.0 m/s in 7.00 s. What is its acceleration?
- Professional Application: Dr. John Paul Stapp was U.S. Air Force officer who studied the effects of extreme deceleration on the human body. On December 10, 1954, Stapp rode a rocket sled, accelerating from rest to a top speed of 282 m/s (1015 km/h) in 5.00 s, and was brought jarringly back to rest in only 1.40 s! Calculate his (a) acceleration and (b) deceleration. Express each in multiples of [latex]g[/latex] [latex]\left(\right. 9 . \text{80 m} /\text{s}^{2} \left.\right)[/latex] by taking its ratio to the acceleration of gravity.
- A commuter backs her car out of her garage with an acceleration of [latex]1 . \text{40 m}/\text{s}^{2}[/latex]. (a) How long does it take her to reach a speed of 2.00 m/s? (b) If she then brakes to a stop in 0.800 s, what is her deceleration?
- Assume that an intercontinental ballistic missile goes from rest to a suborbital speed of 6.50 km/s in 60.0 s (the actual speed and time are classified). What is its average acceleration in [latex]\text{m}/\text{s}^{2}[/latex] and in multiples of [latex]g[/latex] [latex]\left(\right. 9 . \text{80 m} /\text{s}^{2} \left.\right) ?[/latex]
2.5 Motion Equations for Constant Acceleration in One Dimension
- An Olympic-class sprinter starts a race with an acceleration of [latex]4 . \text{50 m}/\text{s}^{2}[/latex]. (a) What is her speed 2.40 s later? (b) Sketch a graph of her position vs. time for this period.
- A well-thrown ball is caught in a well-padded mitt. If the deceleration of the ball is [latex]2 . \text{10} \times \text{10}^{4} \text{ m}/\text{s}^{2}[/latex], and 1.85 ms [latex]\left(\right. \text{1 ms} = \text{10}^{- 3} \text{ s} \left.\right)[/latex] elapses from the time the ball first touches the mitt until it stops, what was the initial velocity of the ball?
- A bullet in a gun is accelerated from the firing chamber to the end of the barrel at an average rate of [latex]6 .\text{20} \times \text{10}^{5} \text{ m}/\text{s}^{2}[/latex] for [latex]8 . \text{10} \times \text{10}^{- 4} \text{ s}[/latex]. What is its muzzle velocity (that is, its final velocity)?
- (a) A light-rail commuter train accelerates at a rate of [latex]1 . \text{35 m}/\text{s}^{2}[/latex]. How long does it take to reach its top speed of 80.0 km/h, starting from rest? (b) The same train ordinarily decelerates at a rate of [latex]1 . \text{65 m}/\text{s}^{2}[/latex]. How long does it take to come to a stop from its top speed? (c) In emergencies the train can decelerate more rapidly, coming to rest from 80.0 km/h in 8.30 s. What is its emergency deceleration in [latex]\text{m}/\text{s}^{2}[/latex]?
- While entering a freeway, a car accelerates from rest at a rate of [latex]2 . \text{40 m}/\text{s}^{2}[/latex] for 12.0 s. (a) Draw a sketch of the situation. (b) List the knowns in this problem. (c) How far does the car travel in those 12.0 s? To solve this part, first identify the unknown, and then discuss how you chose the appropriate equation to solve for it. After choosing the equation, show your steps in solving for the unknown, check your units, and discuss whether the answer is reasonable. (d) What is the car’s final velocity? Solve for this unknown in the same manner as in part (c), showing all steps explicitly.
- At the end of a race, a runner decelerates from a velocity of 9.00 m/s at a rate of [latex]2 . \text{00 m}/\text{s}^{2}[/latex]. (a) How far does she travel in the next 5.00 s? (b) What is her final velocity? (c) Evaluate the result. Does it make sense?
- Professional Application: Blood is accelerated from rest to 30.0 cm/s in a distance of 1.80 cm by the left ventricle of the heart. (a) Make a sketch of the situation. (b) List the knowns in this problem. (c) How long does the acceleration take? To solve this part, first identify the unknown, and then discuss how you chose the appropriate equation to solve for it. After choosing the equation, show your steps in solving for the unknown, checking your units. (d) Is the answer reasonable when compared with the time for a heartbeat?
- In a slap shot, a hockey player accelerates the puck from a velocity of 8.00 m/s to 40.0 m/s in the same direction. If this shot takes [latex]3 . \text{33} \times \text{10}^{- 2} \text{ s}[/latex], calculate the distance over which the puck accelerates.
- A powerful motorcycle can accelerate from rest to 26.8 m/s (100 km/h) in only 3.90 s. (a) What is its average acceleration? (b) How far does it travel in that time?
- Freight trains can produce only relatively small accelerations and decelerations. (a) What is the final velocity of a freight train that accelerates at a rate of [latex]0 . \text{0500 m}/\text{s}^{2}[/latex] for 8.00 min, starting with an initial velocity of 4.00 m/s? (b) If the train can slow down at a rate of [latex]0 . \text{550 m}/\text{s}^{2}[/latex], how long will it take to come to a stop from this velocity? (c) How far will it travel in each case?
- A fireworks shell is accelerated from rest to a velocity of 65.0 m/s over a distance of 0.250 m. (a) How long did the acceleration last? (b) Calculate the acceleration.
- A swan on a lake gets airborne by flapping its wings and running on top of the water. (a) If the swan must reach a velocity of 6.00 m/s to take off and it accelerates from rest at an average rate of [latex]0 . \text{350 m}/\text{s}^{2}[/latex], how far will it travel before becoming airborne? (b) How long does this take?
- Professional Application: A woodpecker’s brain is specially protected from large decelerations by tendon-like attachments inside the skull. While pecking on a tree, the woodpecker’s head comes to a stop from an initial velocity of 0.600 m/s in a distance of only 2.00 mm. (a) Find the acceleration in [latex]\text{m}/\text{s}^{2}[/latex] and in multiples of [latex]g \left(g = 9 . \text{80} \text{ m}/\text{s}^{2}\right)[/latex]. (b) Calculate the stopping time. (c) The tendons cradling the brain stretch, making its stopping distance 4.50 mm (greater than the head and, hence, less deceleration of the brain). What is the brain’s deceleration, expressed in multiples of [latex]g[/latex]?
- An unwary football player collides with a padded goalpost while running at a velocity of 7.50 m/s and comes to a full stop after compressing the padding and his body 0.350 m. (a) What is his deceleration? (b) How long does the collision last?
- In World War II, there were several reported cases of airmen who jumped from their flaming airplanes with no parachute to escape certain death. Some fell about 20,000 feet (6000 m), and some of them survived, with few life-threatening injuries. For these lucky pilots, the tree branches and snow drifts on the ground allowed their deceleration to be relatively small. If we assume that a pilot’s speed upon impact was 123 mph (54 m/s), then what was his deceleration? Assume that the trees and snow stopped him over a distance of 3.0 m.
- Consider a grey squirrel falling out of a tree to the ground. (a) If we ignore air resistance in this case (only for the sake of this problem), determine a squirrel’s velocity just before hitting the ground, assuming it fell from a height of 3.0 m. (b) If the squirrel stops in a distance of 2.0 cm through bending its limbs, compare its deceleration with that of the airman in the previous problem.
- An express train passes through a station. It enters with an initial velocity of 22.0 m/s and decelerates at a rate of [latex]0 . \text{150 m}/\text{s}^{2}[/latex] as it goes through. The station is 210 m long. (a) How long did the nose of the train stay in the station? (b) How fast is it going when the nose leaves the station? (c) If the train is 130 m long, when does the end of the train leave the station? (d) What is the velocity of the end of the train as it leaves?
- Dragsters can actually reach a top speed of 145 m/s in only 4.45 s—considerably less time than given in Example 2.10 and Example 2.11. (a) Calculate the average acceleration for such a dragster. (b) Find the final velocity of this dragster starting from rest and accelerating at the rate found in (a) for 402 m (a quarter mile) without using any information on time. (c) Why is the final velocity greater than that used to find the average acceleration? Hint: Consider whether the assumption of constant acceleration is valid for a dragster. If not, discuss whether the acceleration would be greater at the beginning or end of the run and what effect that would have on the final velocity.
- A bicycle racer sprints at the end of a race to clinch a victory. The racer has an initial velocity of 11.5 m/s and accelerates at the rate of [latex]0 . \text{500 m}/\text{s}^{2}[/latex] for 7.00 s. (a) What is his final velocity? (b) The racer continues at this velocity to the finish line. If he was 300 m from the finish line when he started to accelerate, how much time did he save? (c) One other racer was 5.00 m ahead when the winner started to accelerate, but he was unable to accelerate, and traveled at 11.8 m/s until the finish line. How far ahead of him (in meters and in seconds) did the winner finish?
- In 1967, New Zealander Burt Munro set the world record for an Indian motorcycle, on the Bonneville Salt Flats in Utah, with a maximum speed of 183.58 mi/h. The one-way course was 5.00 mi long. Acceleration rates are often described by the time it takes to reach 60.0 mi/h from rest. If this time was 4.00 s, and Burt accelerated at this rate until he reached his maximum speed, how long did it take Burt to complete the course?
- (a) A world record was set for the men’s 100-m dash in the 2008 Olympic Games in Beijing by Usain Bolt of Jamaica. Bolt “coasted” across the finish line with a time of 9.69 s. If we assume that Bolt accelerated for 3.00 s to reach his maximum speed, and maintained that speed for the rest of the race, calculate his maximum speed and his acceleration. (b) During the same Olympics, Bolt also set the world record in the 200-m dash with a time of 19.30 s. Using the same assumptions as for the 100-m dash, what was his maximum speed for this race?
2.7 Falling Objects
Assume air resistance is negligible unless otherwise stated.
- Calculate the displacement and velocity at times of (a) 0.500, (b) 1.00, (c) 1.50, and (d) 2.00 s for a ball thrown straight up with an initial velocity of 15.0 m/s. Take the point of release to be [latex]y_{0} = 0[/latex].
- Calculate the displacement and velocity at times of (a) 0.500, (b) 1.00, (c) 1.50, (d) 2.00, and (e) 2.50 s for a rock thrown straight down with an initial velocity of 14.0 m/s from the Verrazano Narrows Bridge in New York City. The roadway of this bridge is 70.0 m above the water.
- A basketball referee tosses the ball straight up for the starting tip-off. At what minimum velocity must a basketball player leave the ground to rise 1.25 m above the floor in an attempt to get the ball?
- A rescue helicopter is hovering over a person whose boat has sunk. One of the rescuers throws a life preserver straight down to the victim with an initial velocity of 1.40 m/s and observes that it takes 1.8 s to reach the water. (a) List the knowns in this problem. (b) How high above the water was the preserver released? Note that the downdraft of the helicopter reduces the effects of air resistance on the falling life preserver, so that an acceleration equal to that of gravity is reasonable.
- A dolphin in an aquatic show jumps straight up out of the water at a velocity of 13.0 m/s. (a) List the knowns in this problem. (b) How high does his body rise above the water? To solve this part, first note that the final velocity is now a known and identify its value. Then identify the unknown, and discuss how you chose the appropriate equation to solve for it. After choosing the equation, show your steps in solving for the unknown, checking units, and discuss whether the answer is reasonable. (c) How long is the dolphin in the air? Neglect any effects due to his size or orientation.
- A swimmer bounces straight up from a diving board and falls feet first into a pool. She starts with a velocity of 4.00 m/s, and her takeoff point is 1.80 m above the pool. (a) How long are her feet in the air? (b) What is her highest point above the board? (c) What is her velocity when her feet hit the water?
- (a) Calculate the height of a cliff if it takes 2.35 s for a rock to hit the ground when it is thrown straight up from the cliff with an initial velocity of 8.00 m/s. (b) How long would it take to reach the ground if it is thrown straight down with the same speed?
- A very strong, but inept, shot putter puts the shot straight up vertically with an initial velocity of 11.0 m/s. How long does he have to get out of the way if the shot was released at a height of 2.20 m, and he is 1.80 m tall?
- You throw a ball straight up with an initial velocity of 15.0 m/s. It passes a tree branch on the way up at a height of 7.00 m. How much additional time will pass before the ball passes the tree branch on the way back down?
- A kangaroo can jump over an object 2.50 m high. (a) Calculate its vertical speed when it leaves the ground. (b) How long is it in the air?
- Standing at the base of one of the cliffs of Mt. Arapiles in Victoria, Australia, a hiker hears a rock break loose from a height of 105 m. He can’t see the rock right away but then does, 1.50 s later. (a) How far above the hiker is the rock when he can see it? (b) How much time does he have to move before the rock hits his head?
- An object is dropped from a height of 75.0 m above ground level. (a) Determine the distance traveled during the first second. (b) Determine the final velocity at which the object hits the ground. (c) Determine the distance traveled during the last second of motion before hitting the ground.
- There is a 250-m-high cliff at Half Dome in Yosemite National Park in California. Suppose a boulder breaks loose from the top of this cliff. (a) How fast will it be going when it strikes the ground? (b) Assuming a reaction time of 0.300 s, how long will a tourist at the bottom have to get out of the way after hearing the sound of the rock breaking loose (neglecting the height of the tourist, which would become negligible anyway if hit)? The speed of sound is 335 m/s on this day.
- A ball is thrown straight up. It passes a 2.00-m-high window 7.50 m off the ground on its path up and takes 0.312 s to go past the window. What was the ball’s initial velocity? Hint: First consider only the distance along the window, and solve for the ball’s velocity at the bottom of the window. Next, consider only the distance from the ground to the bottom of the window, and solve for the initial velocity using the velocity at the bottom of the window as the final velocity.
- Suppose you drop a rock into a dark well and, using precision equipment, you measure the time for the sound of a splash to return. (a) Neglecting the time required for sound to travel up the well, calculate the distance to the water if the sound returns in 2.0000 s. (b) Now calculate the distance taking into account the time for sound to travel up the well. The speed of sound is 332.00 m/s in this well.
- A steel ball is dropped onto a hard floor from a height of 1.50 m and rebounds to a height of 1.45 m. (a) Calculate its velocity just before it strikes the floor. (b) Calculate its velocity just after it leaves the floor on its way back up. (c) Calculate its acceleration during contact with the floor if that contact lasts 0.0800 ms [latex]\left(\right. 8 . \text{00} \times \text{10}^{- 5} \text{ s} \left.\right)[/latex]. (d) How much did the ball compress during its collision with the floor, assuming the floor is absolutely rigid?
- A coin is dropped from a hot-air balloon that is 300 m above the ground and rising at 10.0 m/s upward. For the coin, find (a) the maximum height reached, (b) its position and velocity 4.00 s after being released, and (c) the time before it hits the ground.
- A soft tennis ball is dropped onto a hard floor from a height of 1.50 m and rebounds to a height of 1.10 m. (a) Calculate its velocity just before it strikes the floor. (b) Calculate its velocity just after it leaves the floor on its way back up. (c) Calculate its acceleration during contact with the floor if that contact lasts 3.50 ms [latex]\left(\right. 3 . \text{50} \times \text{10}^{- 3} \text{ s} \left.\right)[/latex]. (d) How much did the ball compress during its collision with the floor, assuming the floor is absolutely rigid?
2.8 Graphical Analysis of One-Dimensional Motion
Note: There is always uncertainty in numbers taken from graphs. If your answers differ from expected values, examine them to see if they are within data extraction uncertainties estimated by you.
- (a) By taking the slope of the curve in Figure 2.58, verify that the velocity of the jet car is 115 m/s at [latex]t = \text{20 s}[/latex]. (b) By taking the slope of the curve at any point in Figure 2.59, verify that the jet car’s acceleration is [latex]5 . \text{0 m}/\text{s}^{2}[/latex].
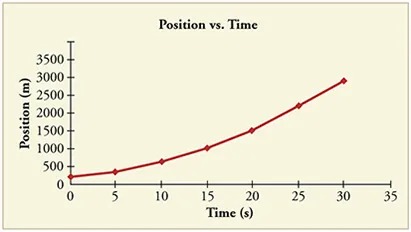
Figure 2.58 Image from OpenStax College Physics 2e, CC-BY 4.0
Image Description
The image is a line graph titled “Position vs. Time.” It displays the relationship between position in meters (m) and time in seconds (s).
The horizontal axis represents time, labeled “Time (s),” and ranges from 0 to 35 seconds with intervals of 5 seconds. The vertical axis represents position, labeled “Position (m),” and ranges from 0 to 3500 meters, with intervals of 500 meters.
A red line with data points plotted as red diamonds shows an increasing pattern. The line starts near the origin, indicating a position close to 0 meters at 0 seconds, and increases non-linearly upwards to approximately 3500 meters at 30 seconds, suggesting acceleration over time.
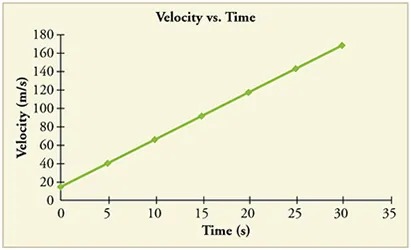
Figure 2.59 Image from OpenStax College Physics 2e, CC-BY 4.0
Image Description
The image is a line graph titled “Velocity vs. Time.” It represents velocity on the vertical axis, labeled as “Velocity (m/s)”, and time on the horizontal axis, labeled as “Time (s)”.
The graph features a straight, diagonal green line with dots at intervals, indicating data points. The line starts at the origin (0,0) and progresses upwards and to the right, indicating a constant increase in velocity over time. The axes are marked with intervals:
– Time (s): Marked at 0, 5, 10, 15, 20, 25, 30, and 35.
– Velocity (m/s): Marked at 0, 20, 40, 60, 80, 100, 120, 140, 160, and 180.
The line suggests that velocity increases at a constant rate with respect to time.
- Using approximate values, calculate the slope of the curve in Figure 2.60 to verify that the velocity at [latex]t = \text{30}.\text{0 s}[/latex] is approximately 0.24 m/s. Assume all values are known to 2 significant figures.
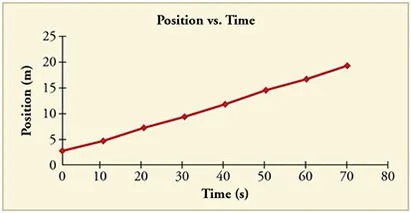
Figure 2.60 Image from OpenStax College Physics 2e, CC-BY 4.0
Image Description
The image is a graph titled “Position vs. Time.” It has an x-axis labeled “Time (s)” ranging from 0 to 80 seconds, and a y-axis labeled “Position (m)” ranging from 0 to 25 meters. The graph displays data points connected with a red line, indicating a linear increase in position over time. The graph shows how position changes consistently, suggesting constant speed.
- Using approximate values, calculate the slope of the curve in Figure 2.60 to verify that the velocity at [latex]t = \text{30}.\text{0 s}[/latex] is approximately 0.24 m/s.
- By taking the slope of the curve in Figure 2.61, verify that the acceleration is [latex]3 . 2 m /\text{s}^{2}[/latex] at [latex]t = \text{10 s}[/latex].
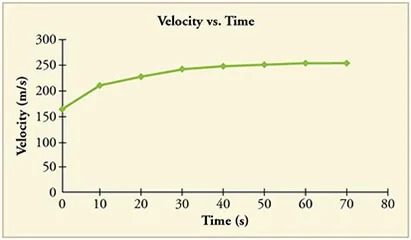
Figure 2.61 Image from OpenStax College Physics 2e, CC-BY 4.0
Image Description
The image is a graph titled “Velocity vs. Time.” It shows a line graph on a rectangular grid with the x-axis labeled “Time (s)” and the y-axis labeled “Velocity (m/s)”.
– The x-axis ranges from 0 to 80 seconds.
– The y-axis ranges from 0 to 300 meters per second.
The data points are plotted and connected with a green line, indicating changes in velocity over time. The trend starts at the origin, quickly rises, and then begins to level off, forming a curve that flattens as time progresses. The velocity appears to increase rapidly at first, then gradually approaches a constant value around 250 m/s from approximately 60 seconds onwards.
- Construct the position graph for the subway shuttle train as shown in Figure 2.18(a). Your graph should show the position of the train, in kilometers, from t = 0 to 20 s. You will need to use the information on acceleration and velocity given in the examples for this figure.
- (a) Take the slope of the curve in Figure 2.62 to find the jogger’s velocity at [latex]t = 2 . 5 s[/latex]. (b) Repeat at 7.5 s. These values must be consistent with the graph in Figure 2.63.
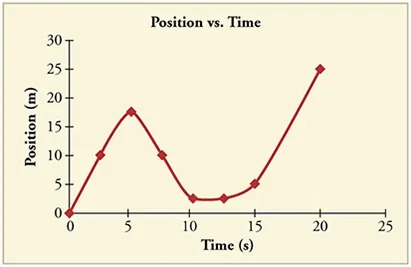
Figure 2.62 Image from OpenStax College Physics 2e, CC-BY 4.0
Image Description
The image is a line graph titled “Position vs. Time.” It shows a red line with diamond markers illustrating the relationship between position and time.
Axes Details:
- The x-axis represents “Time (s)” and is labeled with values from 0 to 25 in increments of 5 seconds.
- The y-axis represents “Position (m)” and is labeled with values from 0 to 30 in increments of 5 meters.
Graph Description:
The graph begins at the origin (0,0), meaning the initial position is 0 meters at 0 seconds. It then follows these movements:
- Increases to around 12 meters at 5 seconds.
- Peaks slightly above 15 meters before dropping to below 5 meters at 10 seconds.
- Rises slightly above 10 meters at 15 seconds.
- Rises sharply again, reaching approximately 25 meters at 20 seconds.
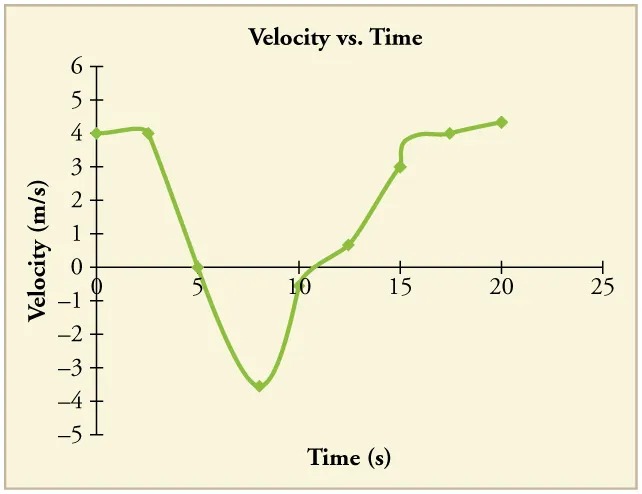
Figure 2.63 Image from OpenStax College Physics 2e, CC-BY 4.0
Image Description
The image is a graph depicting “Velocity vs. Time”. It displays the relationship between velocity, measured in meters per second (m/s), and time, measured in seconds (s).
– The horizontal axis represents time, ranging from 0 to 25 seconds, marked with intervals of 5 seconds.
– The vertical axis represents velocity, ranging from -5 to 6 meters per second, marked with intervals of 1 meter per second.
The graph shows a green line plot with data points marked by small diamonds. Here’s a summary of the plot’s trajectory:
1. Starting at time 0 seconds, the velocity is approximately 4 m/s.
2. At around 2 seconds, the velocity decreases to about 3 m/s, and continues decreasing.
3. By 5 seconds, the velocity drops to 0 m/s.
4. From 5 to 10 seconds, the velocity dips to a minimum of -5 m/s around 8 seconds, followed by an increase back to approximately 0 m/s at 10 seconds.
5. From 10 seconds onward, the velocity is shown to increase steadily, reaching about 4 m/s at 15 seconds.
6. The velocity plateaus slightly just over 3 m/s at around 20 seconds.
7. Finally, from 20 to 25 seconds, the velocity remains stable at a little over 3 m/s.
The overall motion described is a decrease in velocity, a dip into negative velocity indicating a change in direction, followed by a return to positive velocity.
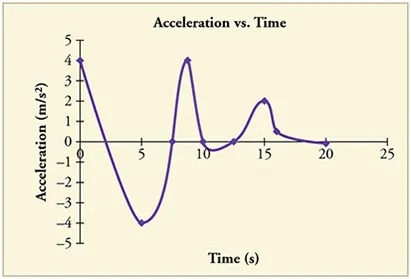
Figure 2.64 Image from OpenStax College Physics 2e, CC-BY 4.0
Image Description
The image is a graph titled “Acceleration vs. Time.” It shows a line graph on a coordinate plane where the x-axis represents time in seconds (ranging from 0 to 25) and the y-axis represents acceleration in meters per second squared (ranging from -5 to 5).
The plot of the graph consists of several peaks and valleys:
- At time 0 seconds, the acceleration starts at 4 m/s².
- At about 4 seconds, there is a steep decline to approximately -5 m/s² around 5 seconds.
- The graph then ascends sharply, reaching a peak of approximately 4.5 m/s² at around 8 seconds.
- Following this, there is a decline to 0 m/s² around 11 seconds.
- Another peak occurs at about 13 seconds with an acceleration of around 2 m/s².
- The graph experiences a slight dip and small fluctuations before flattening out near 0 m/s² as it approaches 20 seconds and beyond.
- A graph of [latex]v \left(t\right)[/latex] is shown for a world-class track sprinter in a 100-m race. (See Figure 2.65). (a) What is his average velocity for the first 4 s? (b) What is his instantaneous velocity at [latex]t = 5 s[/latex]? (c) What is his average acceleration between 0 and 4 s? (d) What is his time for the race?
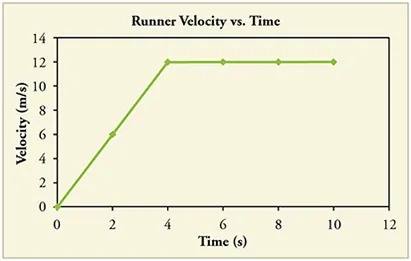
Figure 2.65 Image from OpenStax College Physics 2e, CC-BY 4.0
Image Description
The image is a line graph titled “Runner Velocity vs. Time.” It shows the velocity of a runner over a period of time in seconds.
The x-axis is labeled “Time (s)” and ranges from 0 to 12 seconds. The y-axis is labeled “Velocity (m/s)” and ranges from 0 to 14 meters per second.
The graph line is green and consists of three segments:
- From 0 to 2 seconds, the velocity increases linearly from 0 to 12 meters per second.
- From 2 to 10 seconds, the velocity remains constant at 12 meters per second.
- Figure 2.66 shows the position graph for a particle for 6 s. (a) Draw the corresponding Velocity vs. Time graph. (b) What is the acceleration between 0 s and 2 s? (c) What happens to the acceleration at exactly 2 s?
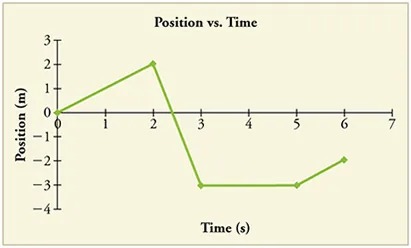
Figure 2.66 Image from OpenStax College Physics 2e, CC-BY 4.0
Image Description
The image is a graph titled “Position vs. Time”. It depicts a line graph with position in meters on the y-axis and time in seconds on the x-axis.
– The graph’s x-axis ranges from 0 to 7 seconds, and the y-axis ranges from -4 to 3 meters.
– At time 0 seconds, the position is at 0 meters.
– From 0 to 2 seconds, the line rises to a position of 3 meters.
– From 2 to 3 seconds, the line drops sharply to a position of 0 meters.
– From 3 to 5 seconds, the line declines further to a position of -3 meters.
– At 5 seconds, the line flattens out at -3 meters, continuing until 6 seconds.
– From 6 to 7 seconds, the line rises to a position of -2 meters.
The line is colored green and marked with data points at each second interval.
- Critical Thinking Two cars are side by side on a path where friction is negligible. Car A starts from rest and has a positive, constant acceleration while car B travels at a constant speed. The cars reach the same check point down the road at the same time. (a) Which car is traveling faster at the check point? Briefly explain your reasoning. (b) Based on experimental data, an equation that fits the data is suggested for the speed of car A at the check point, V, which may not be correct: [latex]V = K V_{0}[/latex], where K is a constant with appropriate units and [latex]V_{0}[/latex] is the initial velocity of car B. Is this equation consistent with your answer from part a? Explain why or why not. Does this equation make sense? Explain why or why not. (c) Graph the velocity of car A and the velocity of car B vs. distance along the path, starting when the cars are side by side.
