9.8 Cohesion and Adhesion in Liquids: Surface Tension and Capillary Action
Learning Objectives
By the end of this section, you will be able to:
- Understand cohesive and adhesive forces.
- Define surface tension.
- Understand capillary action.
Cohesion and Adhesion in Liquids
Children blow soap bubbles and play in the spray of a sprinkler on a hot summer day. (See Figure 9.24.) An underwater spider keeps his air supply in a shiny bubble he carries wrapped around him. A technician draws blood into a small-diameter tube just by touching it to a drop on a pricked finger. A premature infant struggles to inflate her lungs. What is the common thread? All these activities are dominated by the attractive forces between atoms and molecules in liquids—both within a liquid and between the liquid and its surroundings.
Attractive forces between molecules of the same type are called cohesive forces. Liquids can, for example, be held in open containers because cohesive forces hold the molecules together. Attractive forces between molecules of different types are called adhesive forces. Such forces cause liquid drops to cling to window panes, for example. In this section we examine effects directly attributable to cohesive and adhesive forces in liquids.
Cohesive Forces
Attractive forces between molecules of the same type are called cohesive forces.
Adhesive Forces
Attractive forces between molecules of different types are called adhesive forces.
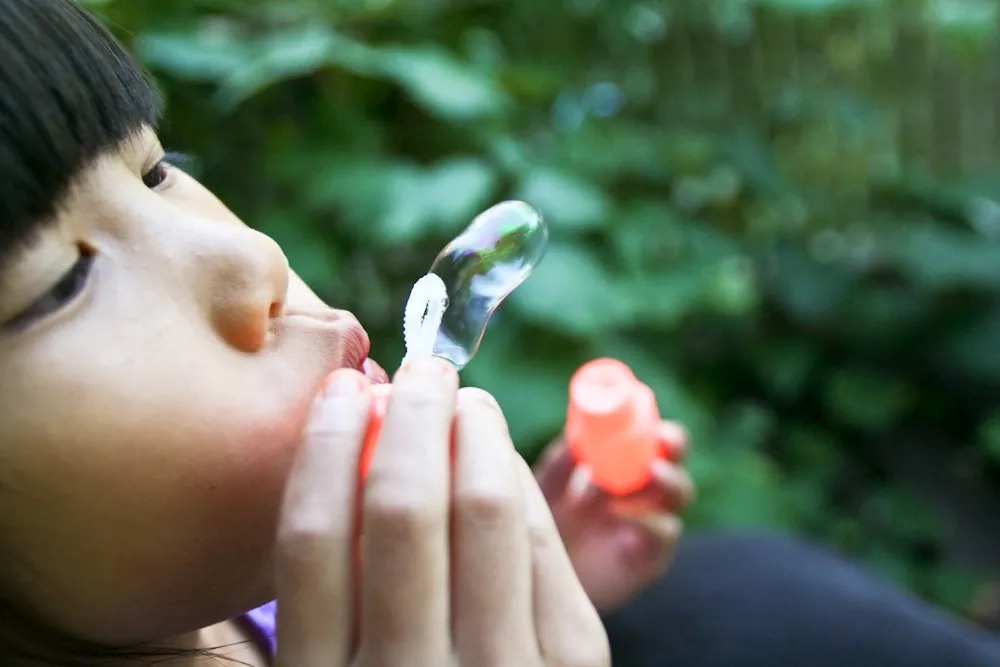
Figure 9.24 The soap bubbles in this photograph are caused by cohesive forces among molecules in liquids. Image from OpenStax College Physics 2e, CC-BY 4.0
Surface Tension
Cohesive forces between molecules cause the surface of a liquid to contract to the smallest possible surface area. This general effect is called surface tension. Molecules on the surface are pulled inward by cohesive forces, reducing the surface area. Molecules inside the liquid experience zero net force, since they have neighbors on all sides.
Surface Tension
Cohesive forces between molecules cause the surface of a liquid to contract to the smallest possible surface area. This general effect is called surface tension.
Making Connections: Surface Tension
Forces between atoms and molecules underlie the macroscopic effect called surface tension. These attractive forces pull the molecules closer together and tend to minimize the surface area. This is another example of a submicroscopic explanation for a macroscopic phenomenon.
The model of a liquid surface acting like a stretched elastic sheet can effectively explain surface tension effects. For example, some insects can walk on water (as opposed to floating in it) as we would walk on a trampoline—they dent the surface as shown in Figure 9.25(a). Figure 9.25(b) shows another example, where a needle rests on a water surface. The iron needle cannot, and does not, float, because its density is greater than that of water. Rather, its weight is supported by forces in the stretched surface that try to make the surface smaller or flatter. If the needle were placed point down on the surface, its weight acting on a smaller area would break the surface, and it would sink.
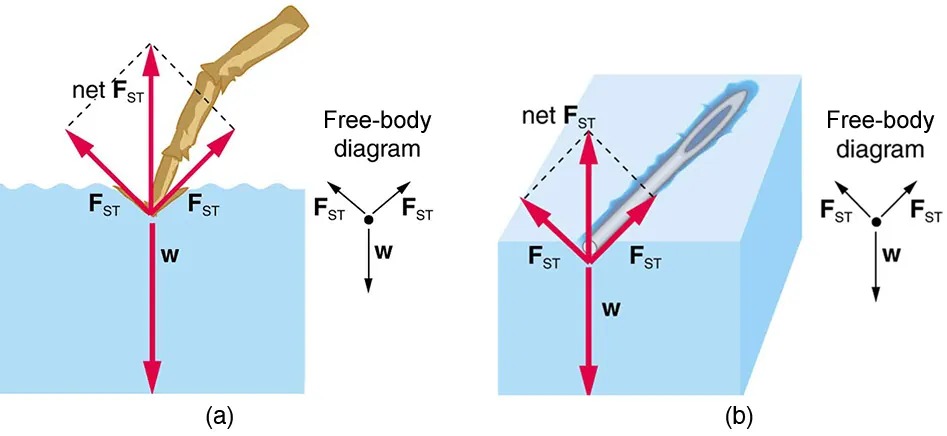
Figure 9.25 Surface tension supporting the weight of an insect and an iron needle, both of which rest on the surface without penetrating it. They are not floating; rather, they are supported by the surface of the liquid. (a) An insect leg dents the water surface. [latex]F_{\text{ST}}[/latex] is a restoring force (surface tension) parallel to the surface. (b) An iron needle similarly dents a water surface until the restoring force (surface tension) grows to equal its weight. Image from OpenStax College Physics 2e, CC-BY 4.0
Image Description
The image consists of two diagrams labeled (a) and (b), each illustrating the concept of surface tension with the use of arrows and free-body diagrams.
Diagram (a):
- A leaf is placed on the surface of a liquid, with arrows indicating forces acting on it.
- The arrows labeled
FSTpoint outward and upward from the leaf, indicating surface tension forces. - An arrow labeled
wpoints downwards, indicating the weight of the leaf. - A dashed arrow labeled
net FSTpoints vertically upward, representing the net surface tension force. - The accompanying free-body diagram shows three arrows: two labeled
FSTdiagonally upward and outward, and one labeledwdownward.
Diagram (b):
- A liquid surface is depicted with a disturbance, possibly created by an object.
- Similar to diagram (a), arrows labeled
FSTpoint outwards and upwards from the contact line. - An arrow labeled
wpoints downwards, showing the weight of the object or disturbance. - A dashed arrow labeled
net FSTpoints vertically upward. - The free-body diagram mirrors the one in (a) with the same force labels and directions.
Surface tension is proportional to the strength of the cohesive force, which varies with the type of liquid. Surface tension [latex]\gamma[/latex] is defined to be the force F per unit length [latex]L[/latex] exerted by a stretched liquid membrane:
[latex]\gamma = \frac{F}{L} .[/latex]
Table 9.3 lists values of [latex]\gamma[/latex] for some liquids. For the insect of Figure 9.25(a), its weight [latex]w[/latex] is supported by the upward components of the surface tension force: [latex]w = γL \text{sin} \theta[/latex], where [latex]L[/latex] is the circumference of the insect’s foot in contact with the water. Figure 9.26 shows one way to measure surface tension. The liquid film exerts a force on the movable wire in an attempt to reduce its surface area. The magnitude of this force depends on the surface tension of the liquid and can be measured accurately.
Surface tension is the reason why liquids form bubbles and droplets. The inward surface tension force causes bubbles to be approximately spherical and raises the pressure of the gas trapped inside relative to atmospheric pressure outside. It can be shown that the gauge pressure [latex]P[/latex] inside a spherical bubble is given by
[latex]P = \frac{4γ}{r} ,[/latex]
where [latex]r[/latex] is the radius of the bubble. Thus the pressure inside a bubble is greatest when the bubble is the smallest. Another bit of evidence for this is illustrated in Figure 9.27. When air is allowed to flow between two balloons of unequal size, the smaller balloon tends to collapse, filling the larger balloon.
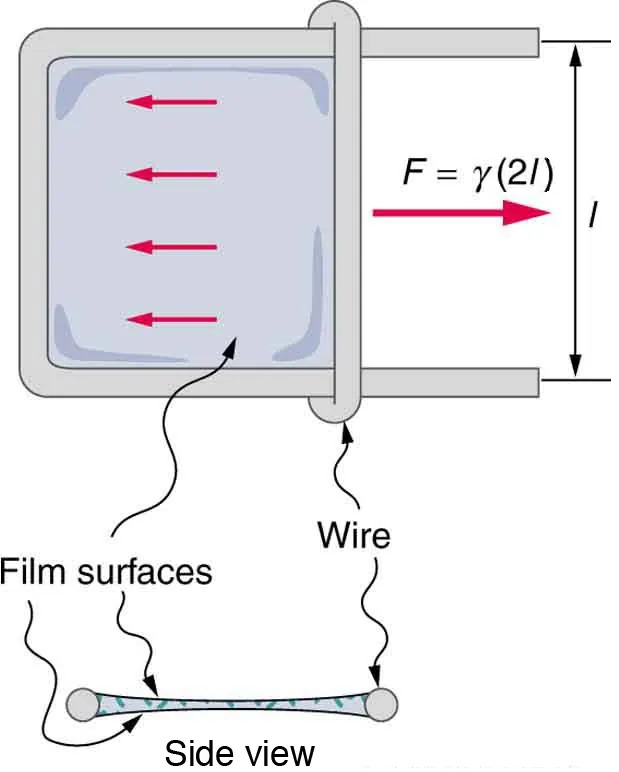
Figure 9.26 Sliding wire device used for measuring surface tension; the device exerts a force to reduce the film’s surface area. The force needed to hold the wire in place is [latex]F = γL = \gamma \left(\right. 2 l \left.\right)[/latex], since there are two liquid surfaces attached to the wire. This force remains nearly constant as the film is stretched, until the film approaches its breaking point. Image from OpenStax College Physics 2e, CC-BY 4.0
Image Description
This image depicts a scientific diagram focusing on concepts related to surface tension and force. The main part of the diagram shows a rectangular frame with a movable wire at the top. Inside the frame, there is a liquid film illustrated with a light gray color and several red arrows indicating force direction. This section is annotated with the formula “F = γ(2l),” where “F” represents force, “γ” represents surface tension, and “l” is the length of the wire. The arrows indicate that the force is being applied horizontally towards the right.
Below the main diagram, there is a side view illustration. This part shows the wire and the film surfaces from the side, further explaining the setup. The term “Film surfaces” is labeled alongside two thin lines representing the liquid film. The “Wire” is marked, showing its position in relation to the film.
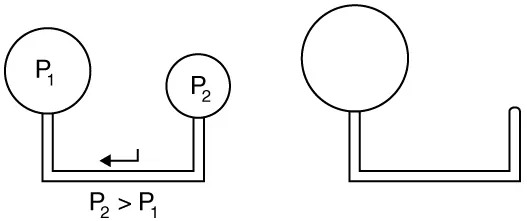
Figure 9.27 With the valve closed, two balloons of different sizes are attached to each end of a tube. Upon opening the valve, the smaller balloon decreases in size with the air moving to fill the larger balloon. The pressure in a spherical balloon is inversely proportional to its radius, so that the smaller balloon has a greater internal pressure than the larger balloon, resulting in this flow. Image from OpenStax College Physics 2e, CC-BY 4.0
Image Description
The image consists of two diagrams illustrating fluid pressure concepts:
1. Left Diagram:
– Two circles labeled “P1” and “P2” are connected by a pipe in a U-shape.
– “P2” is on the right and is higher than “P1,” indicating a higher pressure (P2 > P1).
– An arrow shows the direction of flow from “P2” to “P1” along the pipe.
2. Right Diagram:
– A single larger circle is connected to a U-shaped pipe.
– This part of the illustration represents a single reservoir but does not indicate pressure differences or flow direction.
| Liquid | Surface tension γ(N/m) |
|---|---|
| Water at [latex]0 º \text{C}[/latex] | 0.0756 |
| Water at [latex]\text{20} º \text{C}[/latex] | 0.0728 |
| Water at [latex]\text{100} º \text{C}[/latex] | 0.0589 |
| Soapy water (typical) | 0.0370 |
| Ethyl alcohol | 0.0223 |
| Glycerin | 0.0631 |
| Mercury | 0.465 |
| Olive oil | 0.032 |
| Tissue fluids (typical) | 0.050 |
| Blood, whole at [latex]\text{37} º \text{C}[/latex] | 0.058 |
| Blood plasma at [latex]\text{37} º \text{C}[/latex] | 0.073 |
| Gold at [latex]\text{1070} º \text{C}[/latex] | 1.000 |
| Oxygen at [latex]- \text{193} º \text{C}[/latex] | 0.0157 |
| Helium at [latex]- \text{269} º \text{C}[/latex] | 0.00012 |
Example 9.11
Surface Tension: Pressure Inside a Bubble
Calculate the gauge pressure inside a soap bubble [latex]2 . \text{00} \times \text{10}^{- 4} \text{m}[/latex] in radius using the surface tension for soapy water in Table 9.3. Convert this pressure to mm Hg.
Strategy
The radius is given and the surface tension can be found in Table 9.3, and so [latex]P[/latex] can be found directly from the equation [latex]P = \frac{4γ}{r}[/latex].
Solution
Substituting [latex]r[/latex] and [latex]\gamma[/latex] into the equation [latex]P = \frac{4γ}{r}[/latex], we obtain
[latex]P = \frac{4γ}{r} = \frac{4 \left(\right. 0.037 N/m \left.\right)}{2 . \text{00} \times \text{10}^{- 4} \text{m}} = \text{740} \text{N}/\text{m}^{2} = \text{740} \text{Pa} .[/latex]
We use a conversion factor to get this into units of mm Hg:
[latex]P = \left(\text{740} \text{ N}/\text{m}^{2}\right) \frac{1.00 mm Hg}{\text{133} \text{N}/\text{m}^{2}} = 5.56 mm Hg .[/latex]
Discussion
Note that if a hole were to be made in the bubble, the air would be forced out, the bubble would decrease in radius, and the gauge pressure would reduce to zero, and the absolute pressure inside would decrease to atmospheric pressure (760 mm Hg).
Our lungs contain hundreds of millions of mucus-lined sacs called alveoli, which are very similar in size, and about 0.1 mm in diameter. (See Figure 9.28.) You can exhale without muscle action by allowing surface tension to contract these sacs. Medical patients whose breathing is aided by a positive pressure respirator have air blown into the lungs, but are generally allowed to exhale on their own. Even if there is paralysis, surface tension in the alveoli will expel air from the lungs. Since pressure increases as the radii of the alveoli decrease, an occasional deep cleansing breath is needed to fully reinflate the alveoli. Respirators are programmed to do this and we find it natural, as do our companion dogs and cats, to take a cleansing breath before settling into a nap.
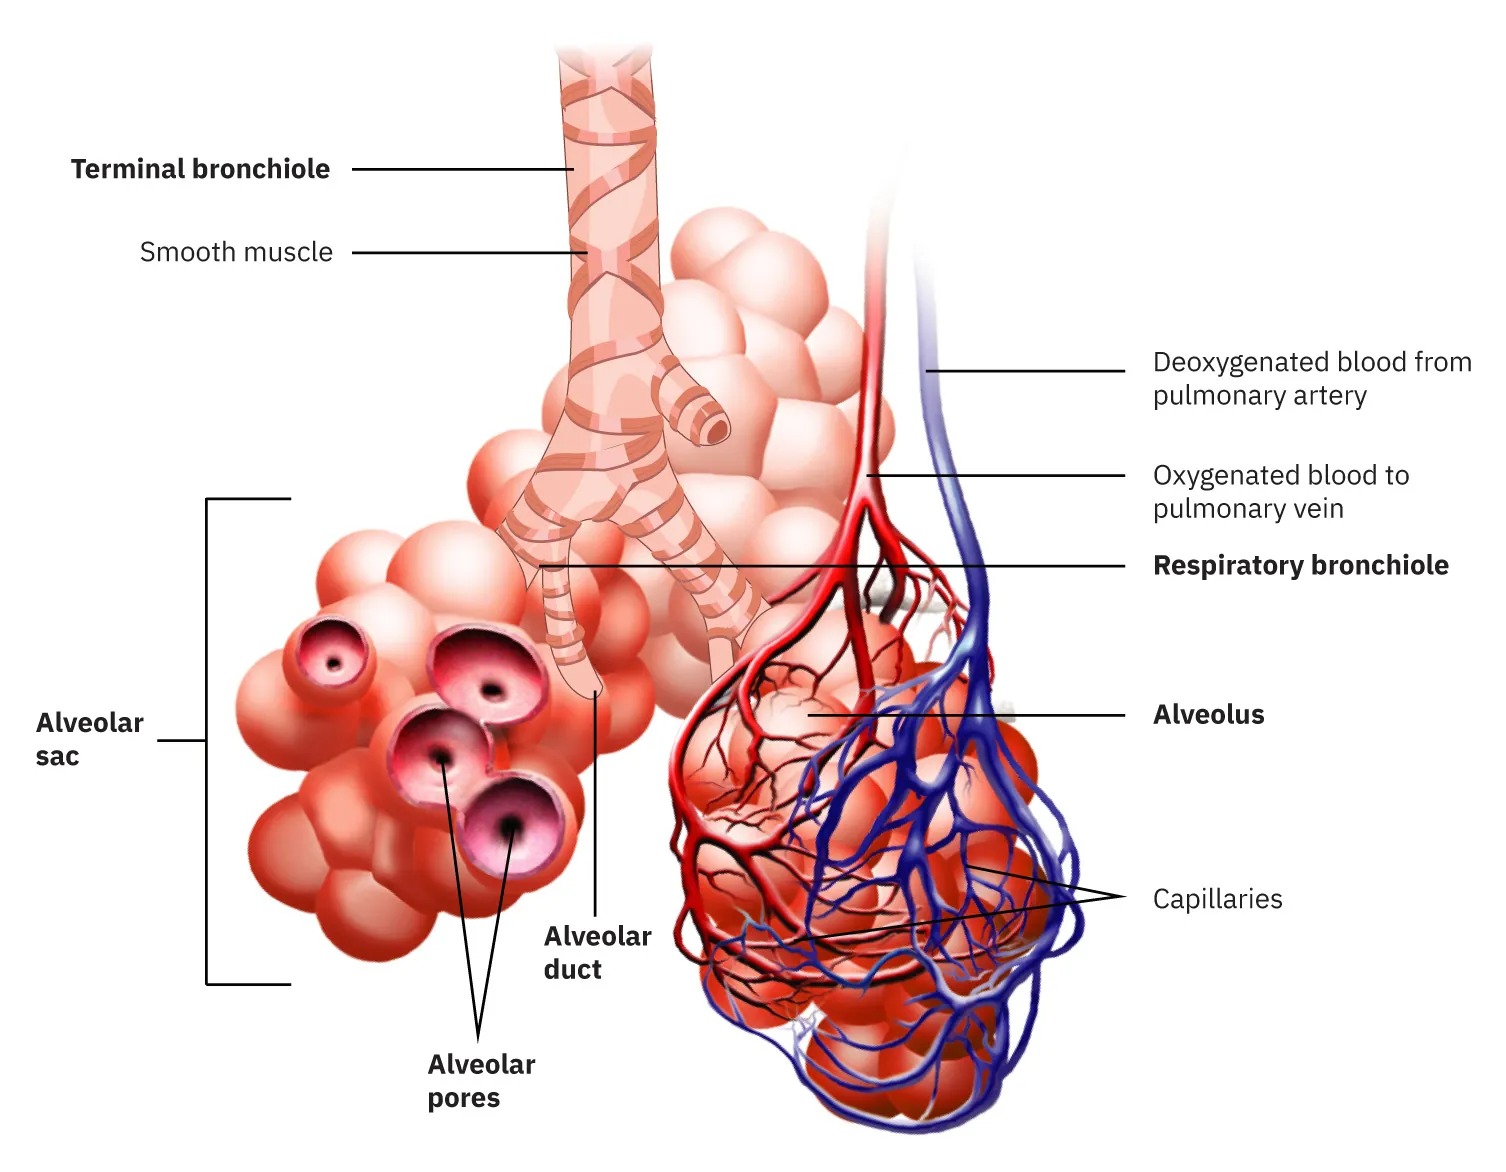
Figure 9.28 Bronchial tubes in the lungs branch into ever-smaller structures, finally ending in alveoli. The alveoli act like tiny bubbles. The surface tension of their mucous lining aids in exhalation and can prevent inhalation if too great. Image from OpenStax College Physics 2e, CC-BY 4.0
Image Description
The image is a detailed medical illustration of the respiratory system’s alveolar region. It depicts the microscopic structures involved in the exchange of gases in the lungs. Key components are labeled to show their function and position.
- Terminal bronchiole: A small airway that leads to the alveolar structures, shown at the top left. It has smooth muscle indicated around it.
- Alveolar sac: A cluster of alveoli, which are small air sacs where gas exchange occurs. This sac is shown on the left side of the image.
- Alveolar duct: Connects the respiratory bronchioles to the alveolar sacs. It is depicted proceeding into the alveolar sac.
- Alveolar pores: Small openings between alveoli allowing for equalization of pressure and gas exchange between alveoli. These are highlighted within the alveolar sac.
- Deoxygenated blood from pulmonary artery: Shown as blue vessels, it represents the blood coming to the lungs to receive oxygen.
- Oxygenated blood to pulmonary vein: Shown as red vessels, it represents the blood leaving the lungs after oxygenation.
- Respiratory bronchiole: Located at the center right, this structure connects bronchioles to alveoli.
- Alveolus: The individual air sacs within the alveolar sac are labeled to show the site of gas exchange.
- Capillaries: Thin blood vessels shown entangled with the alveoli, facilitating the exchange of gases.
The illustration uses color coding to differentiate between oxygenated and deoxygenated blood, with red and blue colors respectively, and highlights the intricate network of capillaries surrounding the alveoli.
The tension in the walls of the alveoli results from the membrane tissue and a liquid on the walls of the alveoli containing a long lipoprotein that acts as a surfactant (a surface-tension reducing substance). The need for the surfactant results from the tendency of small alveoli to collapse and the air to fill into the larger alveoli making them even larger (as demonstrated in Figure 9.27). During inhalation, the lipoprotein molecules are pulled apart and the wall tension increases as the radius increases (increased surface tension). During exhalation, the molecules slide back together and the surface tension decreases, helping to prevent a collapse of the alveoli. The surfactant therefore serves to change the wall tension so that small alveoli don’t collapse and large alveoli are prevented from expanding too much. This tension change is a unique property of these surfactants, and is not shared by detergents (which simply lower surface tension). (See Figure 9.29.)
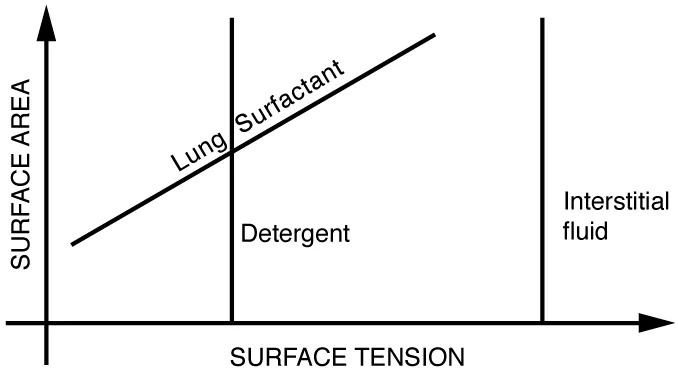
Figure 9.29 Surface tension as a function of surface area. The surface tension for lung surfactant decreases with decreasing area. This ensures that small alveoli don’t collapse and large alveoli are not able to over expand. Image from OpenStax College Physics 2e, CC-BY 4.0
Image Description
This image is a graph depicting the relationship between surface area and surface tension. The x-axis is labeled “SURFACE TENSION” and the y-axis is labeled “SURFACE AREA.” There are three lines shown, each with a different slope, representing different substances:
- Lung Surfactant: A diagonal line with a positive slope, indicating an increase in surface area as surface tension increases.
- Detergent: A vertical line, showing no change in surface area with a change in surface tension.
- Interstitial Fluid: Another vertical line on the right, similar to the detergent line, representing a constant surface area with varying surface tension.
If water gets into the lungs, the surface tension is too great and you cannot inhale. This is a severe problem in resuscitating drowning victims. A similar problem occurs in newborn infants who are born without this surfactant—their lungs are very difficult to inflate. This condition is known as hyaline membrane disease and is a leading cause of death for infants, particularly in premature births. Some success has been achieved in treating hyaline membrane disease by spraying a surfactant into the infant’s breathing passages. Emphysema produces the opposite problem with alveoli. Alveolar walls of emphysema victims deteriorate, and the sacs combine to form larger sacs. Because pressure produced by surface tension decreases with increasing radius, these larger sacs produce smaller pressure, reducing the ability of emphysema victims to exhale. A common test for emphysema is to measure the pressure and volume of air that can be exhaled.
Making Connections: Take-Home Investigation
(1) Try floating a sewing needle on water. In order for this activity to work, the needle needs to be very clean as even the oil from your fingers can be sufficient to affect the surface properties of the needle. (2) Place the bristles of a paint brush into water. Pull the brush out and notice that for a short while, the bristles will stick together. The surface tension of the water surrounding the bristles is sufficient to hold the bristles together. As the bristles dry out, the surface tension effect dissipates. (3) Place a loop of thread on the surface of still water in such a way that all of the thread is in contact with the water. Note the shape of the loop. Now place a drop of detergent into the middle of the loop. What happens to the shape of the loop? Why? (4) Sprinkle pepper onto the surface of water. Add a drop of detergent. What happens? Why? (5) Float two matches parallel to each other and add a drop of detergent between them. What happens? Note: For each new experiment, the water needs to be replaced and the bowl washed to free it of any residual detergent.
Adhesion and Capillary Action
Why is it that water beads up on a waxed car but does not on bare paint? The answer is that the adhesive forces between water and wax are much smaller than those between water and paint. Competition between the forces of adhesion and cohesion are important in the macroscopic behavior of liquids. An important factor in studying the roles of these two forces is the angle [latex]\theta[/latex] between the tangent to the liquid surface and the surface. (See Figure 9.30.) The contact angle [latex]\theta[/latex] is directly related to the relative strength of the cohesive and adhesive forces. The larger the strength of the cohesive force relative to the adhesive force, the larger [latex]\theta[/latex] is, and the more the liquid tends to form a droplet. The smaller [latex]\theta[/latex] is, the smaller the relative strength, so that the adhesive force is able to flatten the drop. Table 9.4 lists contact angles for several combinations of liquids and solids.
Contact Angle
The angle [latex]\theta[/latex] between the tangent to the liquid surface and the surface is called the contact angle.
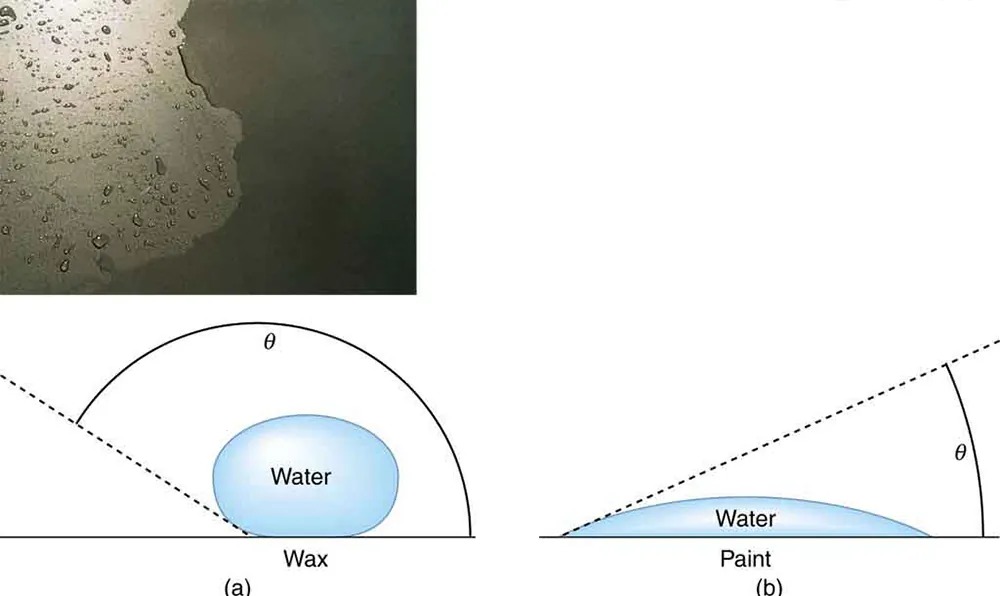
Figure 9.30 In the photograph, water beads on the waxed car paint and flattens on the unwaxed paint. (a) Water forms beads on the waxed surface because the cohesive forces responsible for surface tension are larger than the adhesive forces, which tend to flatten the drop. (b) Water beads on bare paint are flattened considerably because the adhesive forces between water and paint are strong, overcoming surface tension. The contact angle [latex]\theta[/latex] is directly related to the relative strengths of the cohesive and adhesive forces. The larger [latex]\theta[/latex] is, the larger the ratio of cohesive to adhesive forces. Image from OpenStax College Physics 2e, CC-BY 4.0
Image Description
The image contains two parts.
The top section shows a surface with droplets of water scattered across it. The surface appears textured and reflective, possibly made of a material like granite or metal that causes the water to bead up.
The bottom section consists of two separate diagrams labeled (a) and (b).
– Diagram (a) illustrates a drop of water sitting on a wax surface. The water droplet is rounded and forms a high contact angle with the wax, signifying poor wettability. The angle is labeled as θ.
– Diagram (b) shows a drop of water on a paint surface. The water droplet is flatter and spreads more, indicating a smaller contact angle with the paint. This demonstrates better wettability compared to the wax. The angle is also labeled as θ.
These diagrams illustrate the concept of contact angles and wettability on different surfaces.
One important phenomenon related to the relative strength of cohesive and adhesive forces is capillary action—the tendency of a fluid to be raised or suppressed in a narrow tube, or capillary tube. This action causes blood to be drawn into a small-diameter tube when the tube touches a drop.
Capillary Action
The tendency of a fluid to be raised or suppressed in a narrow tube, or capillary tube, is called capillary action.
If a capillary tube is placed vertically into a liquid, as shown in Figure 9.31, capillary action will raise or suppress the liquid inside the tube depending on the combination of substances. The actual effect depends on the relative strength of the cohesive and adhesive forces and, thus, the contact angle [latex]\theta[/latex] given in the table. If [latex]\theta[/latex] is less than [latex]90º[/latex], then the fluid will be raised; if [latex]\theta[/latex] is greater than [latex]90º[/latex], it will be suppressed. Mercury, for example, has a very large surface tension and a large contact angle with glass. When placed in a tube, the surface of a column of mercury curves downward, somewhat like a drop. The curved surface of a fluid in a tube is called a meniscus. The tendency of surface tension is always to reduce the surface area. Surface tension thus flattens the curved liquid surface in a capillary tube. This results in a downward force in mercury and an upward force in water, as seen in Figure 9.31.
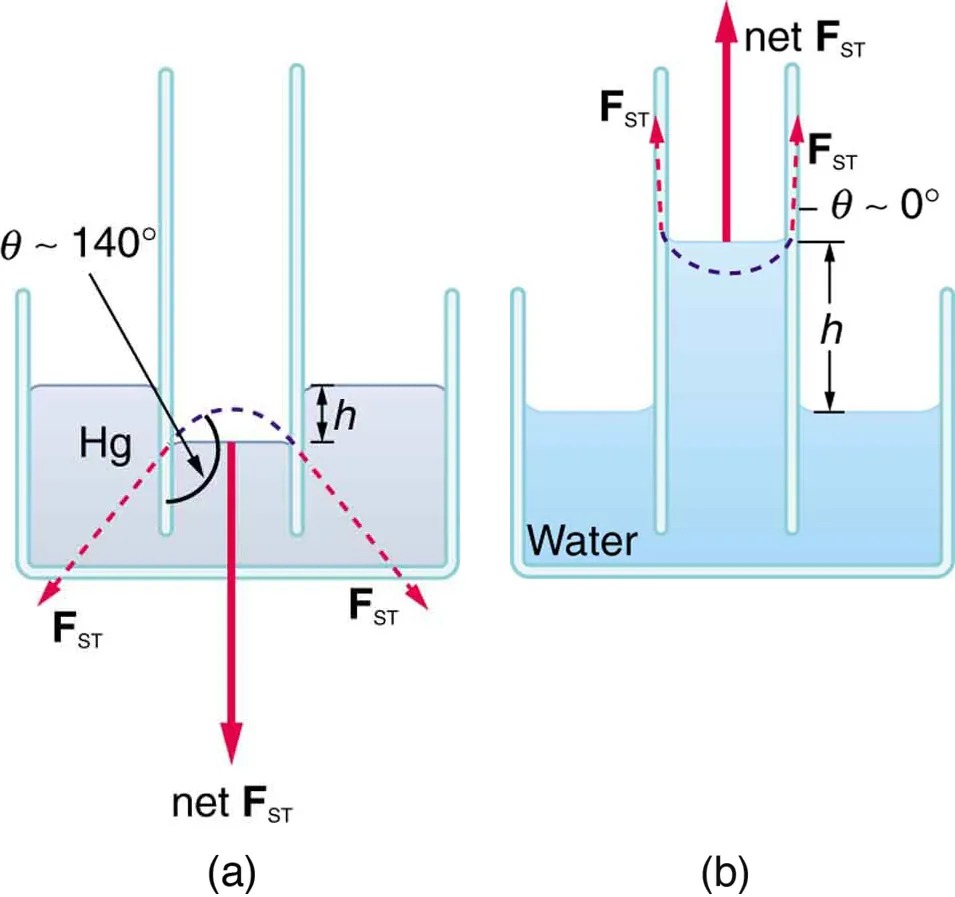
Figure 9.31 (a) Mercury is suppressed in a glass tube because its contact angle is greater than [latex]90º[/latex]. Surface tension exerts a downward force as it flattens the mercury, suppressing it in the tube. The dashed line shows the shape the mercury surface would have without the flattening effect of surface tension. (b) Water is raised in a glass tube because its contact angle is nearly [latex]0º[/latex]. Surface tension therefore exerts an upward force when it flattens the surface to reduce its area. Image from OpenStax College Physics 2e, CC-BY 4.0
Image Description
The image displays two diagrams illustrating capillary action in narrow tubes immersed in two different liquids: mercury (Hg) and water.
(a) The diagram on the left shows mercury (Hg) in a container with narrow tubes. The surface of the mercury is convex, forming a contact angle (θ) of approximately 140 degrees with the glass. The liquid level in the tube is lower than in the container, indicating the repellent nature of the mercury. Arrows labeled FST represent the surface tension forces acting at the liquid-air interface. The net force (net FST) is directed downward outside the tube, illustrating the downward capillary action.
(b) The diagram on the right illustrates water in a similar setup. The water forms a concave surface within the tube, indicating adhesion to the glass surface. The contact angle (θ) is approximately 0 degrees. The liquid level is higher in the tube than in the container, demonstrating the cohesive attraction of water. Arrows labeled FST represent the surface tension forces, with the net force (net FST) directed upward, signifying upward capillary action. Both diagrams are labeled with height (h) to indicate the difference in liquid levels.
| Interface | Contact angle Θ |
|---|---|
| Mercury–glass | [latex]\text{140} º[/latex] |
| Water–glass | [latex]0 º[/latex] |
| Water–paraffin | [latex]\text{107} º[/latex] |
| Water–silver | [latex]\text{90} º[/latex] |
| Organic liquids (most)–glass | [latex]0 º[/latex] |
| Ethyl alcohol–glass | [latex]0 º[/latex] |
| Kerosene–glass | [latex]\text{26} º[/latex] |
Capillary action can move liquids horizontally over very large distances, but the height to which it can raise or suppress a liquid in a tube is limited by its weight. It can be shown that this height [latex]h[/latex] is given by
[latex]h = \frac{2γ \text{ cos} \theta}{\rho \text{gr}} .[/latex]
If we look at the different factors in this expression, we might see how it makes good sense. The height is directly proportional to the surface tension [latex]\gamma[/latex], which is its direct cause. Furthermore, the height is inversely proportional to tube radius—the smaller the radius [latex]r[/latex], the higher the fluid can be raised, since a smaller tube holds less mass. The height is also inversely proportional to fluid density [latex]\rho[/latex], since a larger density means a greater mass in the same volume. (See Figure 9.32.)
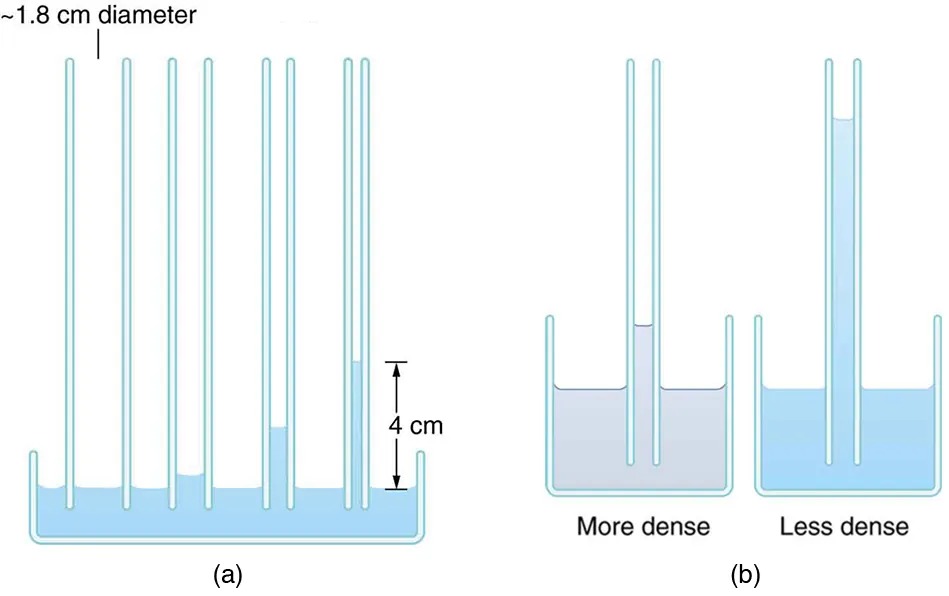
Figure 9.32 (a) Capillary action depends on the radius of a tube. The smaller the tube, the greater the height reached. The height is negligible for large-radius tubes. (b) A denser fluid in the same tube rises to a smaller height, all other factors being the same. Image from OpenStax College Physics 2e, CC-BY 4.0
Image Description
The image contains two diagrams labeled (a) and (b).
(a) The diagram on the left shows a series of vertical tubes with a diameter of approximately 1.8 cm. These tubes are connected at the base by a horizontal section filled with liquid. The fill height of the liquid varies in different tubes, with the tallest section being 4 cm high.
(b) The diagram on the right displays two sets of tubes labeled “More dense” and “Less dense.” In both sets, the tubes are placed in a container filled with liquid. The liquid level inside the tubes is higher in the “More dense” diagram compared to the surrounding liquid. Conversely, in the “Less dense” diagram, the liquid level inside the tubes is also higher, but it differs in height compared to the “More dense” diagram.
Example 9.12
Calculating Radius of a Capillary Tube: Capillary Action: Tree Sap
Can capillary action be solely responsible for sap rising in trees? To answer this question, calculate the radius of a capillary tube that would raise sap 100 m to the top of a giant redwood, assuming that sap’s density is [latex]\text{1050 kg} /\text{m}^{3}[/latex], its contact angle is zero, and its surface tension is the same as that of water at [latex]20.0º C[/latex].
Strategy
The height to which a liquid will rise as a result of capillary action is given by [latex]h = \frac{2γ \text{ cos} \theta}{\rho \text{gr}}[/latex], and every quantity is known except for [latex]r[/latex].
Solution
Solving for [latex]r[/latex] and substituting known values produces
[latex]\begin{eqnarray*}r & = & \frac{2γ \text{ cos} \theta}{\rho \text{gh}}\\ &=& \frac{2 \left(\text{0}.\text{0728 N}/\text{m}\right) \text{cos} \left(0º\right)}{\left(\text{1050} \text{kg}/\text{m}^{3}\right) \left(9 . \text{80} \text{m}/\text{s}^{2}\right) \left(\text{100 m}\right)} \\ & = & 1.41 \times \text{10}^{- 7} \text{m}.\end{eqnarray*}[/latex]
Discussion
This result is unreasonable. Sap in trees moves through the xylem, which forms tubes with radii as small as [latex]2 . 5 \times \text{10}^{- 5} \text{m}[/latex]. This value is about 180 times as large as the radius found necessary here to raise sap [latex]\text{100 m}[/latex]. This means that capillary action alone cannot be solely responsible for sap getting to the tops of trees.
How does sap get to the tops of tall trees? (Recall that a column of water can only rise to a height of 10 m when there is a vacuum at the top—see Example 9.5.) The question has not been completely resolved, but it appears that it is pulled up like a chain held together by cohesive forces. As each molecule of sap enters a leaf and evaporates (a process called transpiration), the entire chain is pulled up a notch. So a negative pressure created by water evaporation must be present to pull the sap up through the xylem vessels. In most situations, fluids can push but can exert only negligible pull, because the cohesive forces seem to be too small to hold the molecules tightly together. But in this case, the cohesive force of water molecules provides a very strong pull. Figure 9.33 shows one device for studying negative pressure. Some experiments have demonstrated that negative pressures sufficient to pull sap to the tops of the tallest trees can be achieved.
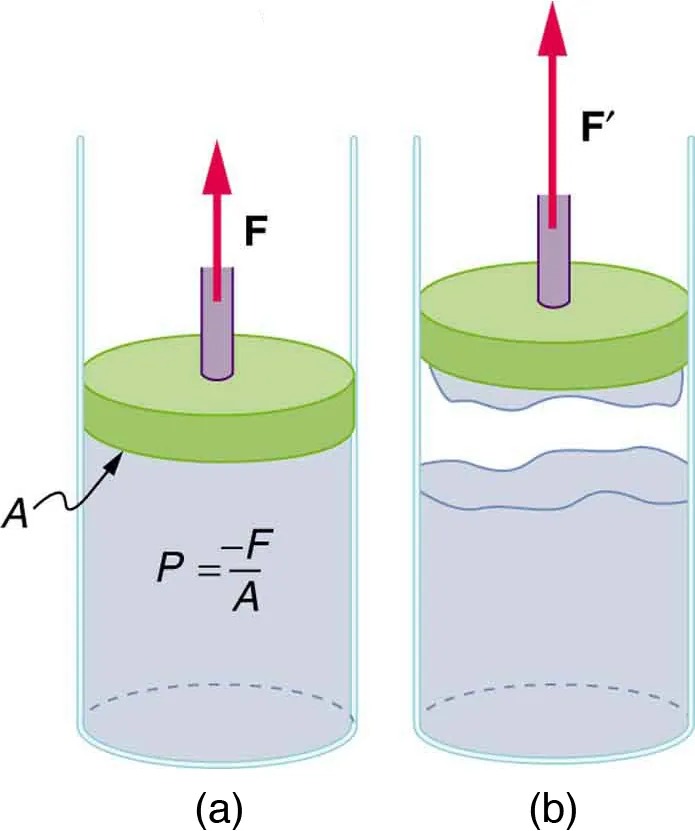
Figure 9.33 (a) When the piston is raised, it stretches the liquid slightly, putting it under tension and creating a negative absolute pressure [latex]P = - F / A[/latex]. (b) The liquid eventually separates, giving an experimental limit to negative pressure in this liquid. Image from OpenStax College Physics 2e, CC-BY 4.0
Image Description
The image consists of two diagrams, labeled (a) and (b), showing a piston in a cylindrical container filled with a fluid.
Diagram (a):
– The piston is pressing down on the fluid in the container.
– An upward force, labeled “F,” is indicated by a red arrow pointing upward from the piston.
– The area of the piston is labeled “A.”
– A formula is shown: \( P = \frac{F}{A} \), representing pressure as the force per unit area.
Diagram (b):
– The piston is moved upward, allowing the fluid to expand and form an irregular surface with waves.
– The upward force is labeled “F'” and indicated with a red arrow pointing upward.
The overall concept is related to the effect of force and area on pressure and how movement of the piston affects the fluid within the container.
- At 20ºC unless otherwise stated. ↵
