8.3 Elections and Representation
 When the electoral system turns votes into seats, the elected government should reflect the people it represents. This is known as the concept of representativeness. There can be several aspects to this. First, the composition of the government should be in line with the partisan preferences of the electorate. Second, the government should, in some manner, represent the social, economic, and demographic characteristics of the population, often called descriptive representation (Blais & Bol, 2023).
Proportionality
The idea of proportionality concerns whether voter preferences are represented in the legislature in proportion to their prevalence in the electorate (Bochsler et al., 2024). While there are complicated statistical approaches to measuring proportionality, the most intuitive way to think about it is to compare the percentage of votes to the percentage of seats. In simple terms, a system would be considered representative if a party getting 30% of the popular vote would win 30% of the seats in government. Proportional systems are designed around this principle, but plurality and majority systems don’t always produce proportionate results:
Ontario’s Disproportionate Elections
In the 2025 provincial election in Ontario, several parties won seats that were not proportional to their share of the vote. For example, the Liberal Party of Ontario received almost 30% of the popular vote, yet only won 11% of the seats. By contrast, the Progressive Conservative party won almost 65% of the seats from receiving 43% of the vote. Hypothetically, under a PR system, the disproportionality would be reduced.
| Party | Popular Vote% | Seats Won | Seats Using PR (hypothetical) |
|---|---|---|---|
| PC | 43 | 80 | 55 |
| LPO | 29.9 | 14 | 38 |
| NDP | 19.6 | 27 | 24 |
| Green | 4.8 | 2 | 6 |
In general, proportional systems tend to be more representative than plurality or majority systems (Blais & Bol, 2023). They also produce more parties in the legislature, measured as the effective number of parties in parliament (ENPP) (Grofman & Lijphart, 1986). In plurality and majority systems with fewer parties in parliament, voters who support smaller parties are less likely to see them represented in the legislature. These disproportionate outcomes can cause dissatisfaction with the political process, sometimes prompting calls for electoral reform (Wilks-Heeg & Crone, 2011).
Descriptive Representation
One common indicator used to measure descriptive representation is to compare the percentage of women represented in legislatures. The Inter Parliamentary Union (IPU) tracks data on representation in parliaments around the world. Globally, women hold only 27% of all seats in lower or unicameral chambers (IPU Parline, 2025). Those numbers are only slightly higher in the Americas, 35% and in Europe, 31% (IPU Parline, 2025).
Electoral Rules and Gender
Countries that use systems of proportional representation tend to elect more women to parliament than plurality/majority systems (ACE Electoral Knowledge Network, n.d.-f). According to 2022 data, the representation of women in legislatures is 6 percentage points higher in countries that use proportional systems compared to those using FPTP (Ridley-Castle, 2023). Additionally, some countries may enforce quotas or reserve legislative seats for women.
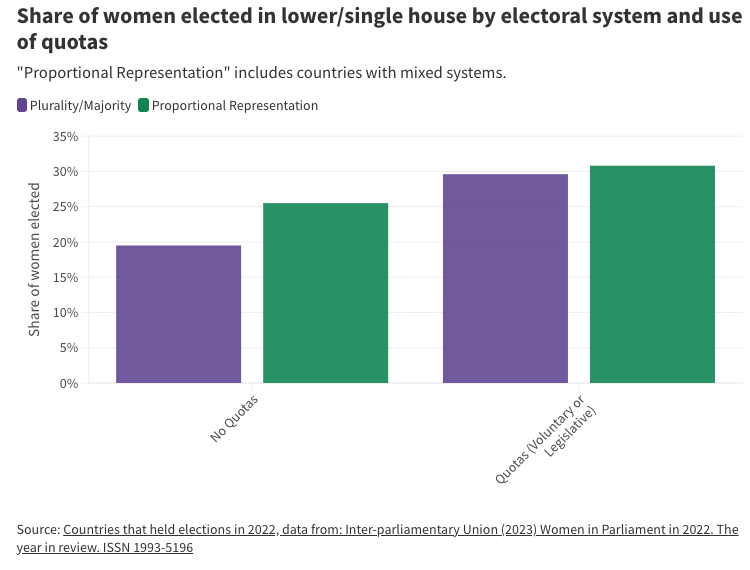
Image Description
Bar chart titled “Share of women elected in lower/single house by electoral system and use of quotas.” It compares the percentage of women elected in countries with two electoral systems: Plurality/Majority (purple bars) and Proportional Representation (green bars), with and without gender quotas.
- Under “No Quotas,” about 20% of women are elected in Plurality/Majority systems and about 26% in Proportional Representation systems.
- Under “Quotas (Voluntary or Legislative),” about 29% of women are elected in Plurality/Majority systems and about 31% in Proportional Representation systems.
A note explains that “Proportional Representation” includes countries with mixed electoral systems.
Districts and Lists
Within PR systems, the representation of women can be affected by differences in district magnitude and the structure of party lists. For example, higher district magnitudes provide parties the opportunity to offer a more diverse slate of candidates (Ridley-Castle, 2023). Additionally, in closed list systems, parties control the position of candidates on the list, not voters. Consequently, parties can place women higher on lists or even use a zipper system to alternate candidate slots between male and female candidates (ACE Electoral Knowledge Network, n.d.-f).
