8.4 Elections and Participation
Another method of assessing the performance of an election is by considering the voter turnout rate. Conventional wisdom suggests that high turnout in some countries is reflective of confidence in elections, while low turnout could be indicative of dissatisfaction. The reality is more nuanced (Kostelka & Blais, 2018).
Turnout in Canada
In Canada, turnout is calculated by dividing the number of valid votes received by the number of registered electors (Elections Canada, 2025, April 28), and it has been on a gradual decline since the 1980s.
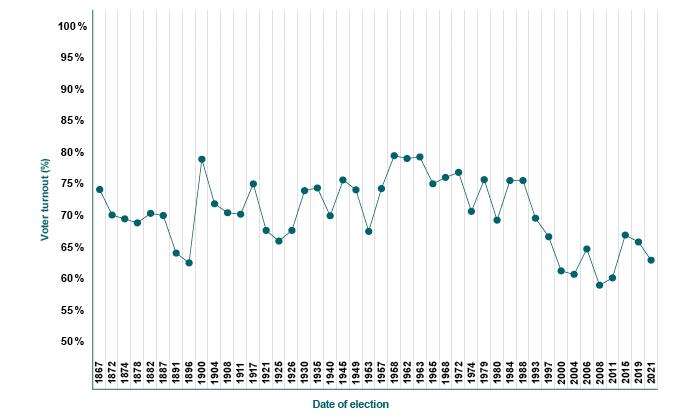
The decline in turnout is likely driven by multiple factors. Canadian voters are generally supportive of the FPTP system, but they have also expressed openness to the idea of electoral reform (Elections Canada, 2003).
Turnout & The Individual
A person’s propensity to vote can often be a function of individual-level factors, such as income or level of education (Solijonov, 2016). Typically, people with higher levels of formal education are more likely to vote (Daoust & Nadeau, 2023), and younger voters are less likely to vote than older voters (Elections Canada, 2023). Voting can also be a social and cooperative exercise influenced by families, peers, and coworkers (Rolfe, 2012).
Turnout & The System
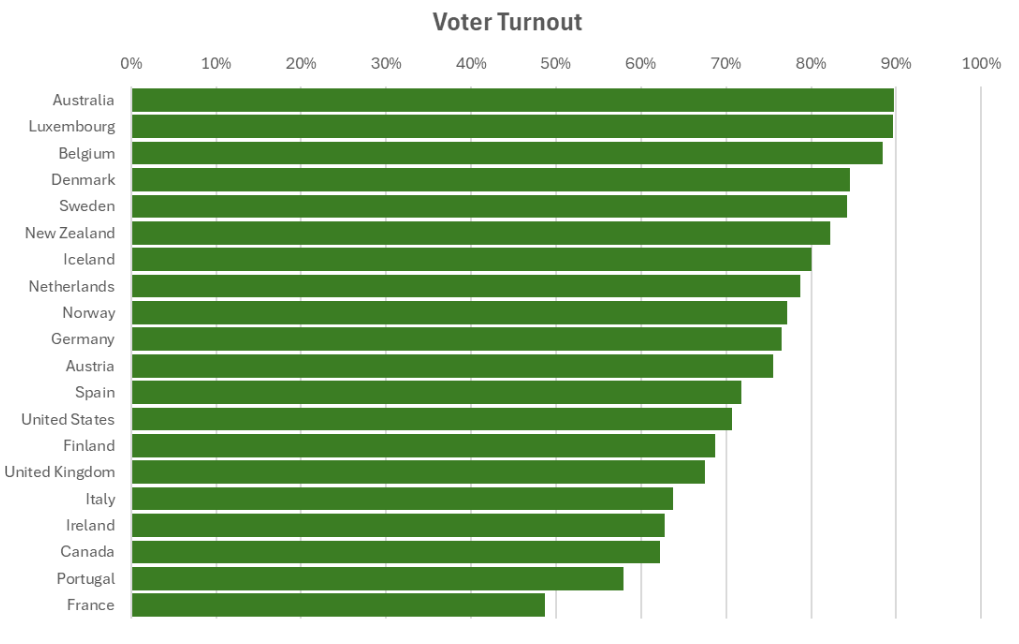
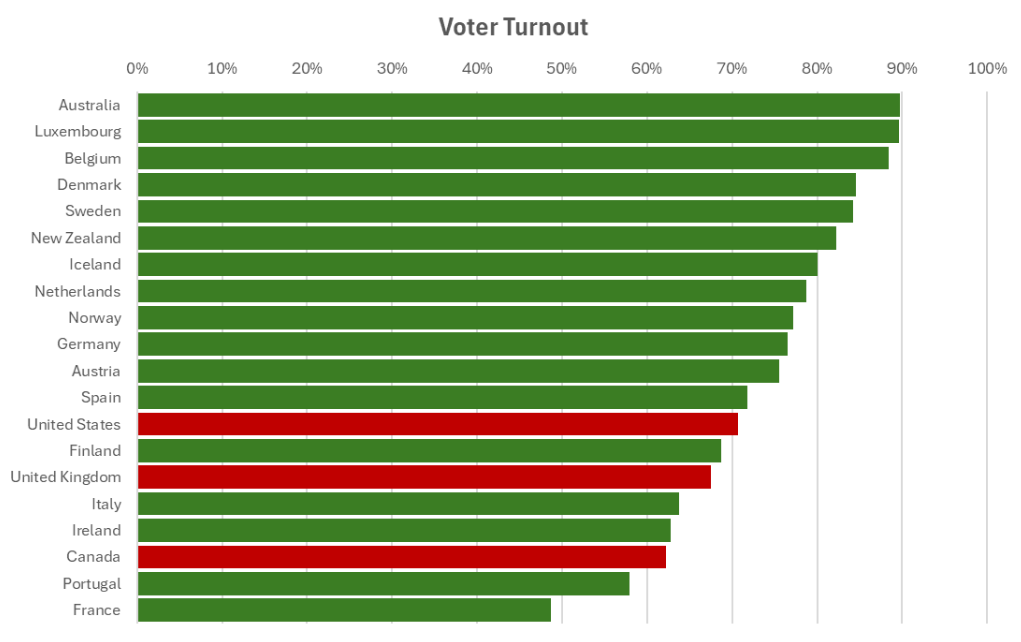
It’s also possible that turnout can be affected by mechanical factors related to the electoral system. The graphs below compare the turnout in 20 democracies. The countries in green use some type of proportional electoral system, while the countries in red use FPTP systems.
Activity Description
Horizontal bar chart titled “Voter Turnout” showing 20 countries ranked by voter turnout from highest (Australia) to lowest (France).
Image 1:
- Australia, Luxembourg, and Belgium lead with the highest turnout rates, nearly 90%.
- France, Portugal, and Canada are at the bottom with turnout rates closer to 60%.
Image 2:
Countries using SMP systems have lower voter turnout
- Red bars highlight countries with relatively lower turnout: the United States (~70%), the United Kingdom (~67%), and Canada (~62%).
Image 3:
Countries with the highest voter turnout enforce compulsory voting
- Blue bars (highest turnout): Australia (~91%), Luxembourg (~89%), Belgium (~87%).
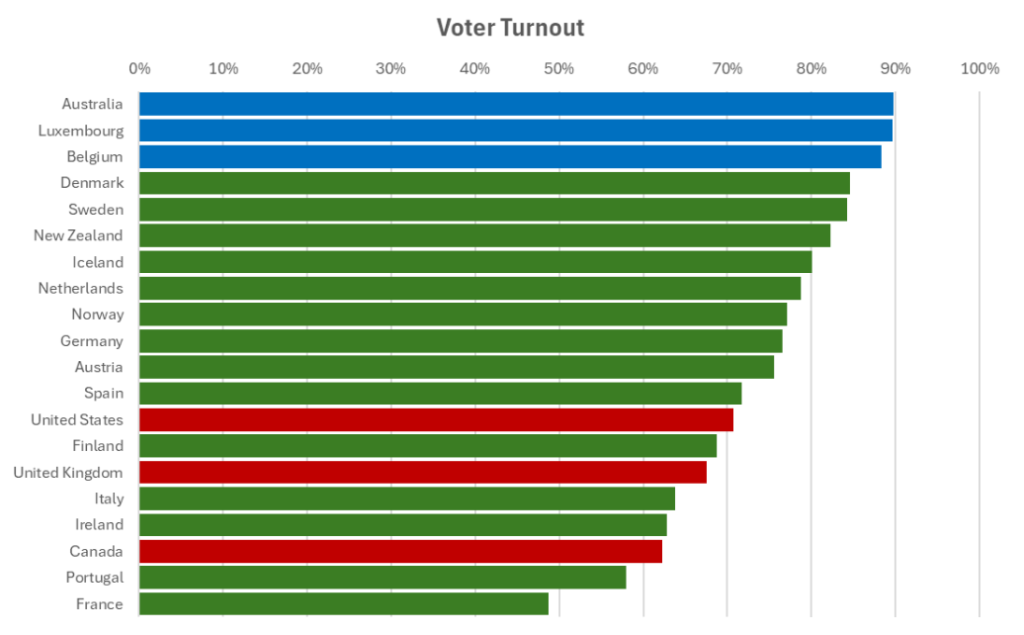
It would be tempting to conclude that PR can lead to higher turnout, yet the highest voter turnout is found in countries with compulsory voting, indicated in blue. Voter turnout can only tell us so much about the performance of elections.
