Dữ liệu bao gồm các lá phiếu của [latex]n=100[/latex] Thượng nghị sĩ trong Thượng viện Hoa Kỳ khóa 2004-2006, cho tổng cộng [latex]m=542[/latex] dự luật. Các phiếu “Đồng ý” (“Yay”) được biểu diễn bằng số 1, các phiếu “Không đồng ý” (“Nay”) bằng số -1, và các phiếu khác được ghi nhận là 0. (Một số yếu tố phức tạp bị bỏ qua ở đây, chẳng hạn như khả năng bỏ phiếu cặp.)
Dữ liệu này có thể được biểu diễn ở đây dưới dạng một ma trận ‘‘bỏ phiếu’’ kích thước [latex]m \times n[/latex]
\[ X = [x_{1},\dots,x_{n}], \]
với các phần tử lấy từ tập [latex]\{-1, 0, 1\}[/latex]. Mỗi cột của ma trận bỏ phiếu [latex]x_{j}, j=1,\dots,n[/latex] chứa các lá phiếu của một Thượng nghị sĩ duy nhất cho tất cả các dự luật; mỗi hàng chứa các lá phiếu của tất cả các Thượng nghị sĩ cho một dự luật cụ thể.
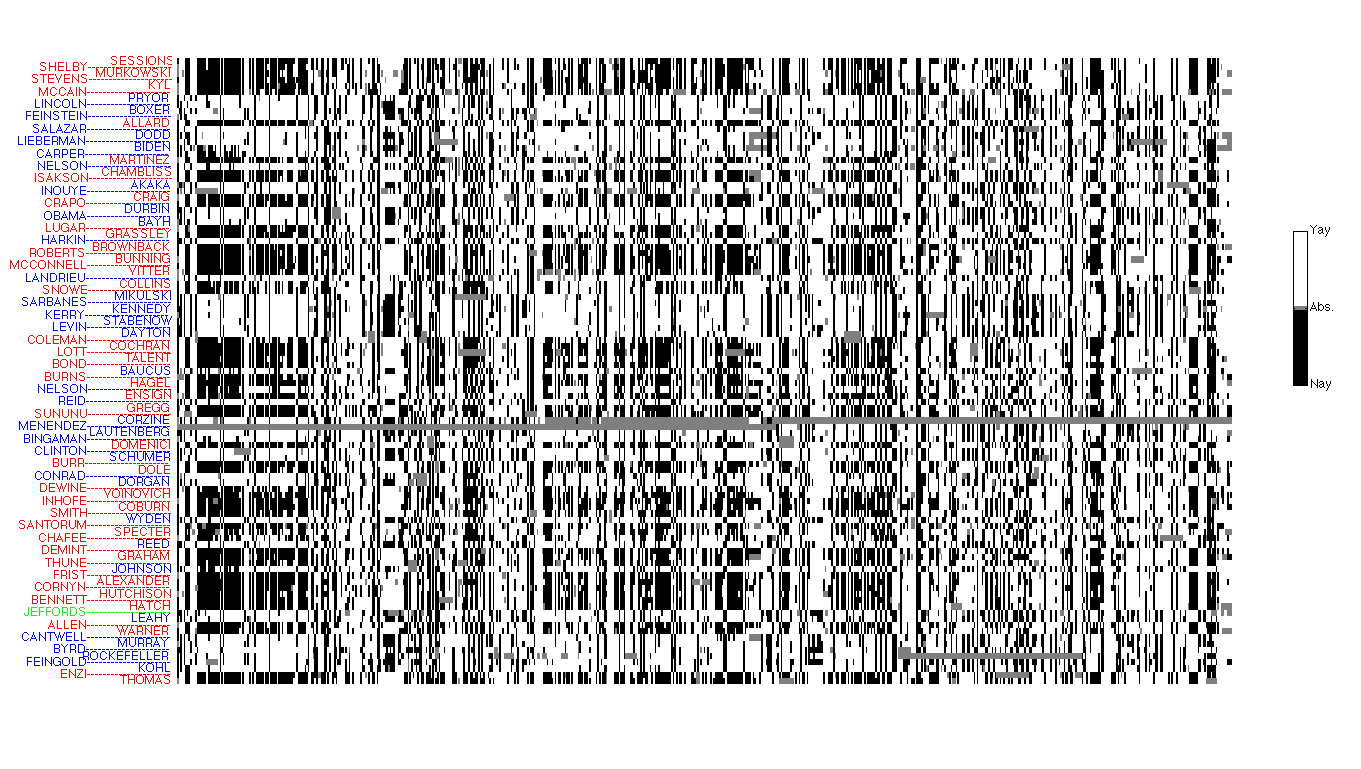 |
Ma trận bỏ phiếu của Thượng viện: các phiếu “Không đồng ý” màu đen, các phiếu “Đồng ý” màu trắng, và các phiếu khác màu xám. Ma trận bỏ phiếu chuyển vị được hiển thị. Hình ảnh có nhiều vùng màu xám do một số Thượng nghị sĩ được thay thế theo thời gian. Việc chỉ đơn thuần vẽ ma trận dữ liệu thô thường không cung cấp nhiều thông tin. |
