Miscibility of Amorphous Blends
Rebecca Ploeger
1. Author’s Information, Intended Audience & Abstract
Author’s Information
Rebecca Ploeger, Art Conservation Department, SUNY – Buffalo State University; ploeger@buffalostate.edu
Publishing Information
Published March 2024
Intended Audience
This exercise is designed to investigate miscibility of amorphous polymeric materials commonly used by conservators.
Abstract
Observations will be made regarding the chemical miscibility of materials in terms of final optical properties, physical properties and glass transition temperature (Tg). The aim is to help young conservators evaluate the success of a blend by interpreting tactile and visual observations and comparing them to instrumental results.
This exercise is published:
Ploeger, Rebecca. 2018. “Differential Scanning Calorimetry for Art Conservation Graduate Students: A Practical Laboratory Exercise using Polymer Blends.” Journal of Chemical Education. 95 (7): 1192-1197.
2. Introduction and Theory
Hypothesis
Blending two amorphous polymers will allow for a single new glass transition temperature (Tg) that is an average of the individual components. This may be predicted by the Fox equation.
Concept
Miscibility of polymers is complex and can be unpredictable. Often measurements (in conservation) are empirical in nature, meaning that one cannot simply rely on theory.
Students Will:
- Recognize that general conclusions on miscibility are possible with visual and tactile observations.
- Conclude that a hypothesis is only sometimes true.
- Measure thermal transitions of polymers.
3. References
Arslanoglu, Julie, and Tom Learner. 2001. The Evaluation of Laropal A81: Paraloid B-72 Blend Varnises for Painted and Decorative Surface: Optical and Aesthetic Properties.” The Conservator 25 (1): 62-72.
Cimino, Dafne, Oscar Chiantore, E. René de la Rie, Christofer W. McGlinchey, Rebecca Ploeger, Tommaso Poli, and Johannes A. Poulis. 2016. “Binary mixtures of ethylene containing copolymers and low molecular weight resins: a new approach towards specifically tuned art conservation products.” International Journal of Adhesion and Adhesives. 67: 54-62.
Schmidt, Paige L., Aaron Shugar, and Rebecca Ploeger. 2017. “Analytical Observations Regarding Butvar B98 and Paraloid B72 Blends as a Suitable Adhesive in Hot Climates.” MRS Advances 2 (35-36): 1927-1941.
Ploeger, Rebecca. 2018. “Differential Scanning Calorimetry for Art Conservation Graduate Students: A Practical Laboratory Exercise using Polymer Blends.” Journal of Chemical Education. 95 (7): 1192-1197.
4. Case Study
Schmidt, Paige L., Aaron Shugar, and Rebecca Ploeger. 2017. “Analytical Observations Regarding Butvar B98 and Paraloid B72 Blends as a Suitable Adhesive in Hot Climates.” MRS Advances 2 (35-36): 1927-1941.
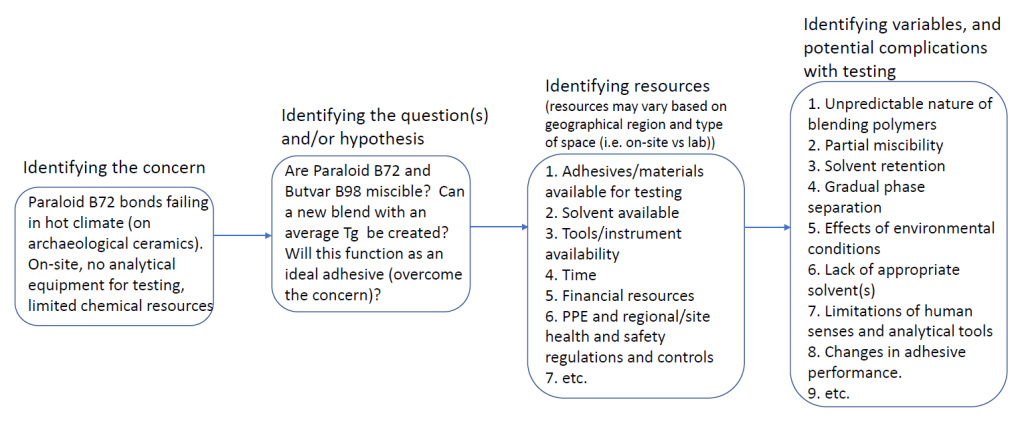
This study was motivated by complications observed from on-site archaeological conservation during the heat of the Mediterranean summer. Paraloid B72 repairs were failing because temperatures in the storage areas were reaching 40°C, the Tg of the resin. The idea was to blend Paraloid B72 and Butvar B98, a resin with a higher Tg around 72-78°C, to achieve a final adhesive with a Tg somewhere in the middle.
As there was no DSC available, blends were created on site, and visual and tactile observations were made to determine if the materials were miscible. The Fox equation was used to determine a theoretical Tg of a blend based on literature Tg values.
Those visual and tactile observations were confirmed with analytical equipment.
A partial incompatibility between the resins was observed, and there was further separation with time.
5. Key Images
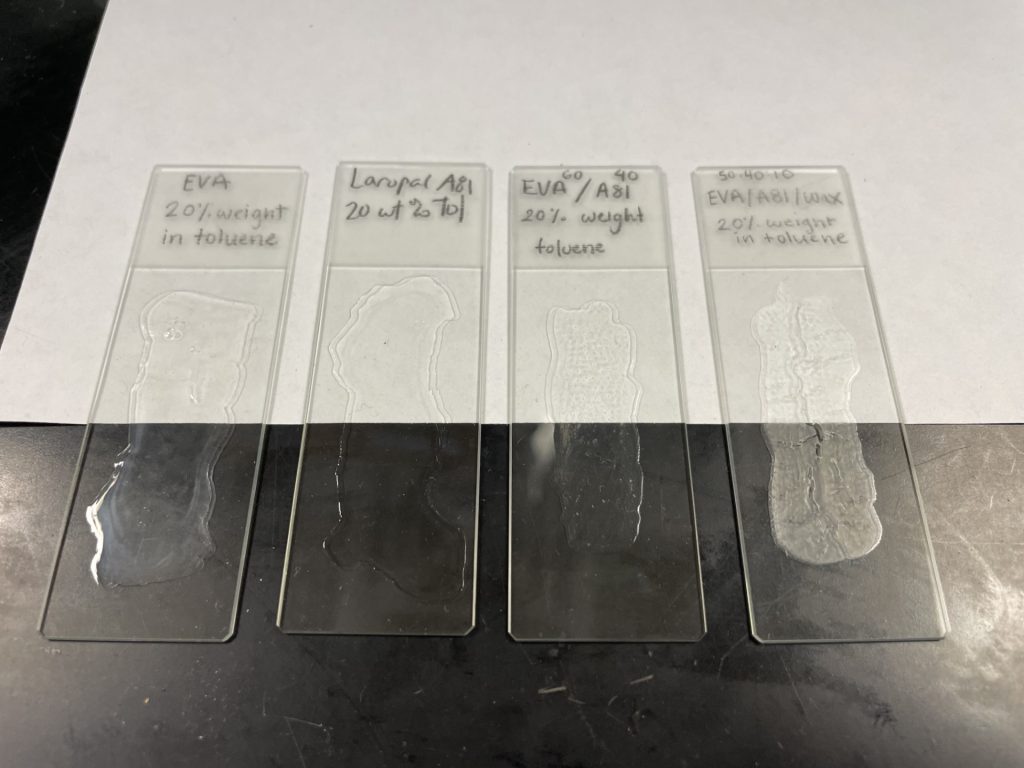
Long description of figure 2. Laropal A81 and EVA blends on microscope slides over a half black and half white background to show their textures and opacities. From left to right: 1) EVA; 2) Laropal A81; 3) 60% EVA: 40% Laropal; and 4) 50% EVA: 40% Laropal A81: 10% wax blends. All blends drawn out on slides are 20% weight in toulene. Laropal A81 is transparent. The 60% EVA: 40% Laropal A81 blend is slightly more translucent with small inclusions throughout the film. 100% EVA is translucent with a slightly milky appearance. The 50% EVA: 40% Laropal A81: 10% wax blend is an opaque grey film with wrinkling and cracking.
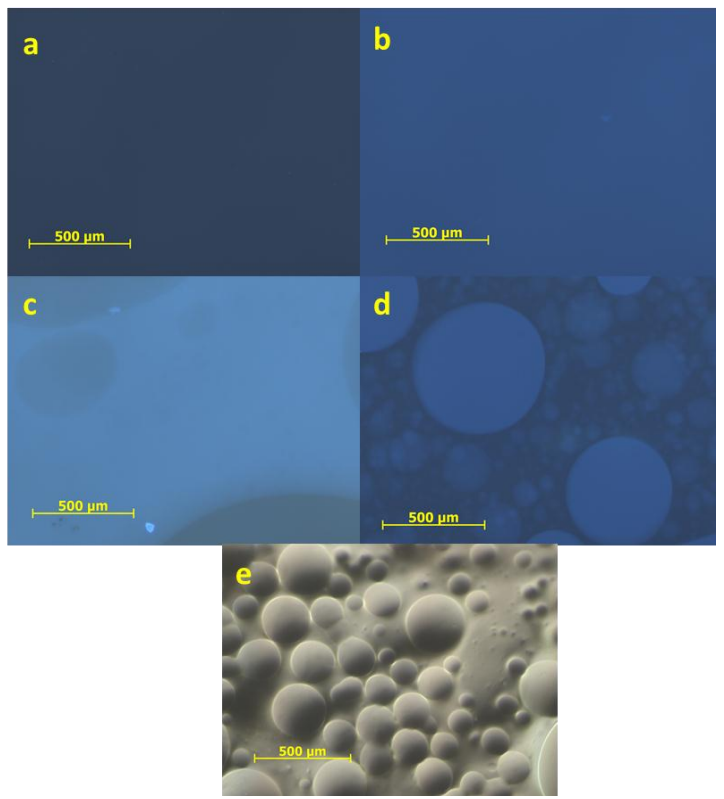
Textual description of figure 3. a. Solid dark blue image; b. solid mid-toned blue image; c. grey-blue circles at the edges of a light blue background; d. various-sized mid-toned blue circles over a dark blue background; e. shaded grey spheres atop a grey background. All images have a 500 micron scale bar.
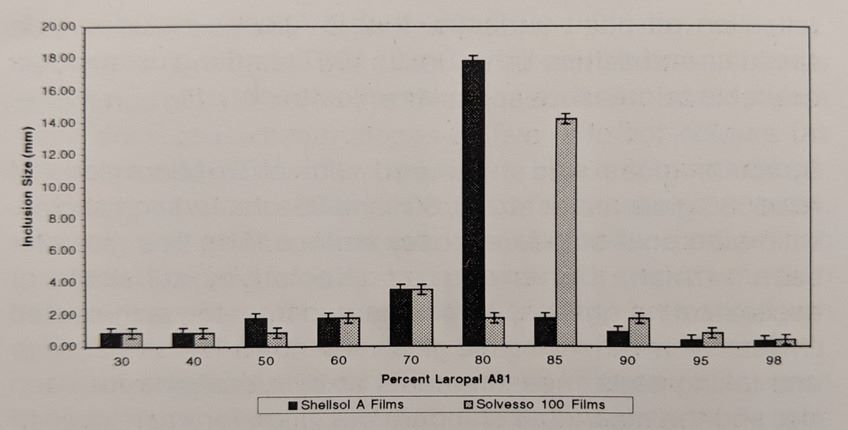
Long description of figure 5. Bar graph showing the sizes of inclusions (mm) in Laropal A81: Paraloid B-72 blends, from 30% to 98% Laropal A81. Distribution in inclusion size ranged from 0.48 – 17 microns. Maximum inclusion sizes were seen at 80% Laropal A81 for Shellsol A films and at 85% for Solvesso 100 films. All other inclusion sizes were less than approximately 4 microns.
6. Instrumentation
Differential Scanning Calorimetry (DSC)
This technique will be used to determine the glass transition temperature (Tg) of the blend. If a blend is successful, a single Tg will be observed; if a blend is not successful (or is partial), multiple Tg’s will be observed. Effects of solvents used for preparing the blends may also be observed and should be considered and discussed.
Microscopy
This technique will be used to investigate the visual properties of the films. Optical microscopy (stereomicroscope or optical microscope) can be used to help confirm what the trained eye is observing on a macroscopic level. Miscibility issues (phase separation) can be observed as a lack of transparency of films. Note that semi-crystalline and crystalline polymers will have some level of opaqueness due to phase boundaries between crystals.
Tactile Observations
Manipulating the film (cutting and removing it from the substrate) will help students understand the final physical properties. Are the films brittle or flexible? Does the blended system have new properties compared to individual materials?
7. Laboratory
Instructions
Cast out individual components as controls (to observe shifts in the Tg from solvent retention and to understand tactile properties).
Create blends of polymers and observe miscibility. Try different ratios, e.g. 20:80, 50:50 and 80:20 (in an appropriate solvent). Cast blends onto unfrosted glass slides. Observe any changes in optical properties before and after drying. Use black matboard or background to help with observations (opaqueness), if necessary. Make visual observations before manipulating the samples, as stresses may induce crazing and other phenomena that may cause opaqueness. Note: work with and cast films under a fume hood (or with appropriate ventilation) and use correct PPE.
Suggested blend options (based on case study and references): a) Paraloid B72 and Laropal A81 OR b) Paraloid B72 and Butvar B98.
Students will first observe different visual and physical properties. These observations will be supported with DSC results.
Students can calculate ideal theoretical Tg’s of miscible blends using the Fox equation. The calculation should be done with the Tg’s of the individual cast components (to observe and consider any solvent retention effects), but also from literature Tg values.
Other Suggestions to Help Reinforce Concepts and Goals
Use blends that are known to work (are miscible) and known to fail (are immiscible); have students prepare both and make observations based on their human detectors (eyes and hands) before performing DSC analyses. Use the DSC results to confirm the initial observations.
8. Discussion and Challenges
Promoting Discussion and Critical Thinking: Questions and Problematic Sub-Topics
Points that require visual and tactile observations:
Are the films transparent? Are they opaque or mottled? What do you think this means in terms of miscibility?
What are the mechanical properties? Have they changed, compared to the original components?
Points that require analytical or instrumental calculations and observations:
How many Tg temperatures were observed?
If one – was it an average of the two components?
If two – are they close to those of the original components?
Do you see evidence of a partial blend? This could be, for example, when there are two Tg’s, where one is close to an original component and the other is in-between. What did the film look like (e.g. transparent or opaque)?
Is the Tg lower than you would expect? Do you think the solvent (solvent retention) may be playing a role? Do you think it may change over time (solvent evaporation)?
Is the Tg similar to a theoretical one calculated with the Fox equation? Why could they differ?
Is there a difference between the theoretical Tg (from the Fox equation) using the values from the individual cast components, and those from the literature? Why are they different?
More advanced:
Do you think the phase separation can occur over time? How would you measure and/or observe it?
What may be consequences to the final film?

Feedback/Errata