Project Initiation and Planning
9 Gantt Chart
 In order to manage the scheduling of your project, tools such as Gantt charts are important. When timing is limited and there are activities that have dependencies, it is key to stay on track. The Gantt chart is a tool that allows us to visually see our schedule and compare our actual progress to our planned progress. It is also a key tool for accountability. By assigning specific people to the task, if things are not being completed it is clear who is to be doing the work. A Gantt chart is a horizontal bar chart that shows a project’s planned schedule and tasks or events over the assigned timeframe.
It helps you see your entire project timeline and track milestones as you go. Many Gantt charts can also show dependencies. They can include multiple team members, colour-coded tasks, calendars, and more.
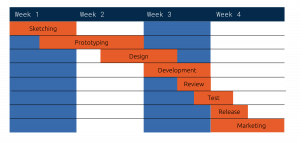
In essence, the horizontal axis of a Gantt chart represents the time, and the vertical axis shows the tasks involved with the project. Identical units of distance along the horizontal axis represent equivalent units of time. Then, you showcase each task with a bar. The length of these bars represents the time estimated for each task and their positioning on the chart represent how they’re scheduled.
Key Components
Tasks/Item (Deliverables)
There are individual activities (or tasks) that live at various stages of completion. Each task can stand on its own, and you can also group tasks together to create sub-items.
Planned Date/Timeline
The date and duration (planned timeline) of each task are often displayed in days/weeks/months, but they can also be represented in minutes/hours. The length of each rectangle tells you how long a task is expected to take, known as the duration of the task.
Actual Start/End
While it is anticipated you will stay on track with your plan, there may be tasks or elements that start or end early/late. Instead of changing the entire schedule, it is important to note these “actual” points as a separate piece of information.
Owner
This is the person assigned to and responsible for the task (can be more than one person). Tasks should not be repeatedly assigned to the entire team (unless the task requires all to participate), as this minimizes accountability and responsibility of individuals.
Status
The status represents what stage each task currently resides in. These can include up next, planned, stuck, waiting for, completed, delayed, working on, etc.
Progress
The status represents what proportion of the work is completed within the designated timeline and is usually represented as a percentage.
Milestones
The overarching tasks do not have a duration, and generally mark the end of a certain part of a project.
Dependencies
Often represented as arrows that link two tasks together (optional).
Things to Remember
While planning takes time and may not produce tangible client deliverables, it will help you have a well-organized execution which will allow you to identify roadblocks as they come along and ensure completion of requirements. Give yourself some flexibility in timing to allow for adjustments that may arise and try to identify them as early as possible.
Courses and Guided Projects
Create a Simple Gantt Chart Using Google Sheets (Jamie Schroeder, Coursera)
Visualize Project Milestones with Gantt Charts in Miro (Tricia Bagley, Coursera)
Create a Simple Gantt Using Excel (Andres Rodriguez, Coursera)
Project Scheduling: Estimate Activity Duration (Hamid Aougab, Coursera)
A horizontal bar chart that shows a project’s planned schedule and its tasks or events over a specific time
Relationships between products or tasks
