Chapter 5: Economics and Banking
Chapter 5 Learning Outcomes
After reading this chapter, you should be able to do the following:
- Describe different types of global economic systems according to how they control the factors of production through input and output markets.
- Describe the law of supply and demand and how the equilibrium price is determined.
- Identify the various degrees of competition in the Canadian economic system.
- Describe what occurs at each of the four stages of the business cycle.
- Explain how the unemployment rate in Canada is measured and the four different types of unemployment that occur.
- Explain how the Consumer Price Index (CPI) measures inflation.
- Summarize how the government uses both monetary and fiscal policies to stabilize the economy as a result of business cycle fluctuations.
- List four crucial properties of money in order for it to be a medium of exchange.
- Explain how the World Bank and the International Monetary Fund assist with international trade.
How Business and Economics Work
To appreciate how a business functions, we need to know something about the economic environment in which it operates. We begin with a definition of economics and a discussion of the resources used to produce goods and services.
A business’s success depends in part on the economic systems of the countries where it is located and where it sells its products. A nation’s economic system is the combination of policies, laws, and choices made by its government to establish the systems that determine what goods and services are produced and how they are allocated. Economics is the study of how individuals, businesses, governments, and nations allocate their limited resources to satisfy their unlimited wants and needs. It is how a society uses scarce resources to produce and distribute goods and services. The resources of a person, a firm, or a nation are limited, and in economics this limitation is known as scarcity. An example of scarcity would be if food were limited throughout a geographic region due to a drought or a harsh winter. Scarcity is one of the key concepts of economics. It means that the demand for a good or service is greater than the availability of the good or service. Hence, economics is the study of choices—what people, firms, or nations choose from among the available resources. Every economy is concerned with what types and amounts of goods and services should be produced, how they should be produced, and for whom. These decisions are made by the marketplace, the government, or both.
Microeconomics is the study of individuals and business decisions. Macroeconomics looks at the decisions of countries and governments. These two branches of economics appear to be different but in reality, they’re interdependent and complement each other. You probably know more about economics than you realize. Every day, many news stories deal with economic matters: a union wins wage increases at General Motors, the Bank of Canada lowers interest rates, Wall Street has a record day, the prime minister proposes a cut in income taxes, consumer spending rises as the economy grows, or retail prices are on the rise, to mention just a few examples. In Canada, the government and the free-market system guide the economy together.
Resources: Inputs and Outputs
The allocation of resources is concerned with the production, distribution, and consumption of goods and services. Resources are the inputs used to produce outputs.
Resources may include any or all of the following and their connections with one another:
- Land and other natural resources
- Labour (physical and mental)
- Capital, including buildings and equipment
- Entrepreneurship
- Knowledge
Resources are combined to produce goods and services. Land and natural resources provide the needed raw materials. Labour transforms raw materials into goods and services. Capital (equipment, buildings, vehicles, cash, and so forth) is needed for the production process. Entrepreneurship provides the skill, drive, and creativity needed to bring the other resources together to produce a good or service to be sold in the marketplace.
Because a business uses resources to produce goods, these resources are often referred to as factors of production. For example, the factors of production involved in making a shirt include:
- Land–the physical space the factory occupies, the electricity used to power the plant, and the raw cotton used to make the shirts.
- Labour–the workers who manufacture the shirts.
- Capital–the factory, machinery, and equipment used in production, along with the financial resources required to operate the business.
- Entrepreneurship–the skills and knowledge needed to organize the other resources effectively and bring the product to market.
Input and Output Markets
The circular flow model is simply a way of depicting how money circulates through the economy from individuals to firms in the form of labor and buying goods and services. Then, from firms to individuals in the form of wages, and providing goods/services.[1] Many of the factors of production are provided to businesses by households. For example, households provide businesses with labour (as workers), land and buildings (as landlords), and capital (as investors). In turn, businesses pay households for these resources by providing them with income, such as wages, rent, and interest. The resources obtained from households are then used by businesses to produce goods and services, which are sold to provide businesses with revenue. The revenue obtained by businesses is then used to buy additional resources, and the cycle continues. This is described in Figure 5.1 below, “The Circular Flow of Inputs and Outputs”, which illustrates the dual roles of households and businesses:
- Households not only provide factors of production (or resources) but also consume goods and services.
- Businesses not only buy resources but also produce and sell both goods and services.
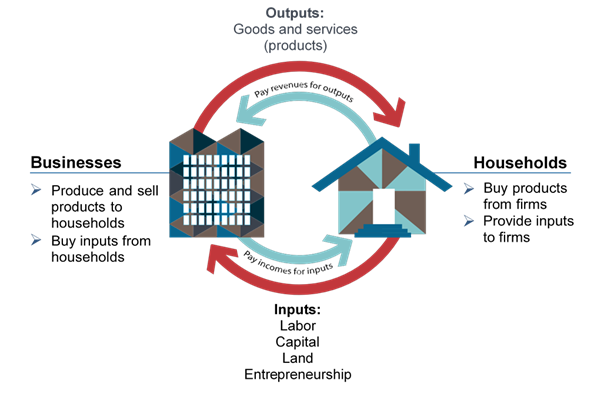
The Circular Flow of Inputs and Outputs illustrates the dual roles of households and businesses. Households not only provide factors of production (or resources) but also consume goods and services. Businesses not only buy resources but also produce and sell both goods and services. Outputs include goods and services (or products). Inputs include labor, capital, land, and entrepreneurship.
This version of the circular flow model is stripped down to the essentials, but it has enough features to explain how the product and labour markets work in the economy. We could easily add details to this basic model if we wanted to introduce more real-world elements, like financial markets, governments, and interactions with the rest of the globe (imports and exports).
Productivity
Productivity refers to how efficiently goods and services are being produced. Theoretically, higher levels of labor productivity equal higher economic output and lower inflation. Productivity increases when more output is produced with the same amount of inputs or when the same amount of output is produced with fewer inputs. Productivity in economics is usually measured as the ratio of what is produced (an aggregate output) to what is used in producing it (an aggregate input).
Labor productivity is the most common productivity measure—it’s defined as economic output (gross domestic product, or GDP) per hour worked. Labor productivity is typically the biggest determinant of economic and wage growth in the long term. And over time, labor productivity and real wages are closely—though not exactly—linked. Labour productivity tends to rise with increases in technology. On a country scale, labor productivity is frequently calculated as a ratio of GDP per total hours worked. So, if a country’s GDP were $1 trillion and its people worked 20 billion hours to create that value, the country’s labor productivity would be $50 per hour.[2]
Economists measure other types of productivity, too. Capital productivity is a measure of how well physical capital, such as real estate, equipment, and inventory, is used to generate output such as goods and services. (Capital productivity and labor productivity are frequently considered together as an indicator of a country’s overall standard of living.) Total factor productivity is the portion of growth in output not explained by growth in labor or capital. This type of productivity is sometimes called “innovation-led growth.”[3]
Explore the Concept: Your Role in the Canadian Economy
Curious about your role in the Canadian economy? Plug in a few facts about yourself and compare them with national and regional data from across Canada. At the end, your profile, as well as your place in the economy, will be revealed. Figure 5.2 shows a results page after taking the “Your Role in the Canadian Economy” Quiz. Give it a try! You will see how you compare to other Canadians.
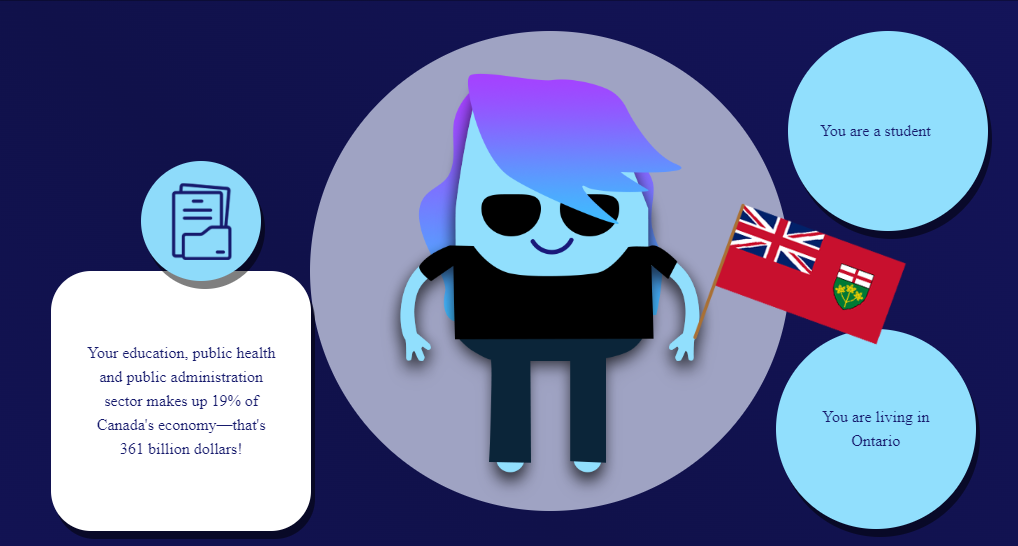 Figure 5.2 Your Role in the Canadian Economy Quiz
Economic Systems
Economists study the interactions between households and businesses and look at the ways in which the factors of production are combined to produce the goods and services that people need. Basically, economists try to answer three sets of questions:
- What goods and services should be produced to meet consumers’ needs? In what quantity? When?
- How should goods and services be produced? Who should produce them, and what resources, including technology, should be combined to produce them?
- Who should receive the goods and services produced? How should they be allocated among consumers? The answers to these questions depend on a country’s economic system — the means by which a society (households, businesses, and government) makes decisions about allocating resources to produce products and about distributing those products. The degree to which individuals and business owners, as opposed to the government, enjoy freedom in making these decisions varies according to the type of economic system.
Economic Systems Defined:
- A free market economy is an economic system in which the production and distribution of goods and services are primarily determined by supply and demand with minimal government intervention. In this system, private individuals and businesses own the means of production, and transactions are conducted in a competitive market environment. People decide how to use factors of production, such as land, labor, capital, and physical resources. In a market economy, producers decide what to produce, how much to charge, and what to sell.
- A mixed economy is an economic system where some resources are planned for by the government, while citizens control others. The world’s dominant economic organization is a mixed economy.
- A planned economy is a system where the state determines production levels and regulates prices. In a centrally planned economy, the state uses advanced planning mechanisms to determine production levels, rather than supply and demand.
- Capitalism is an economic system that promotes the creation and ownership of capital and wealth. A free market system is a capitalist system that focuses on the unfettered exchange of goods and services, with little or no interference by the government.
- Socialism is an economic and political system where the means of production are owned by the public or the state, rather than private individuals. It’s based on the idea that shared ownership of resources leads to a more equal society. Socialism is generally considered a planned economy, where the government controls the production of goods and services, rather than a market economy.
- Communism is a political and economic system that aims to eliminate class struggles by having the public own the means of production, such as factories and mines. In a communist society, there is no private property or currency, and wealth is shared equally or based on need. Communism is not the same as a planned economy, but communism is often associated with centrally planned economies.
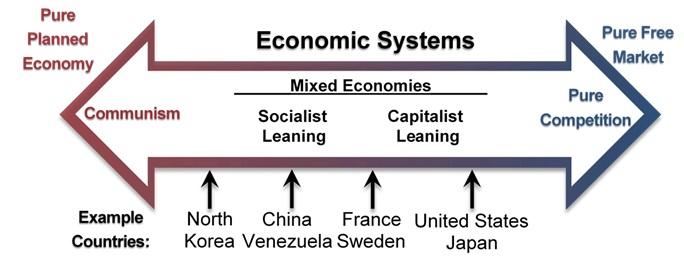
Generally speaking, economic systems can be divided into two systems: planned systems and free market systems (Refer to Figure 5.3).
Planned Systems
In a planned system, the government exerts control over the allocation and distribution of all or some goods and services. The system with the highest level of government control is communism. In theory, a communist economy is one in which the government owns all or most enterprises. Central planning by the government dictates which goods or services are produced, how they are produced, and who will receive them. In practice, pure communism is practically nonexistent today, and only a few countries (notably North Korea and Cuba) operate under rigid, centrally planned economic systems.
Under socialism, industries that provide essential services, such as utilities, banking, and health care, may be government-owned. Some businesses may also be owned privately. Central planning allocates the goods and services produced by government-run industries and tries to ensure that the resulting wealth is distributed equally. In contrast, privately owned companies are operated for the purpose of making a profit for their owners. In general, workers in socialist economies work fewer hours, have longer vacations, and receive more health care, education, and child-care benefits than do workers in capitalist economies. To offset the high cost of public services, taxes are generally steep. Examples of countries that lean towards a socialistic approach include Venezuela, Sweden, and France.
Free Market System
The free market system is an economic system in which most businesses are owned and operated by individuals, also known as capitalism. In a free market economy, competition dictates how goods and services will be allocated. Business is conducted with more limited government involvement, concentrated on regulations that dictate how businesses are permitted to operate. A key aspect of a free market system is the concept of private property rights, which means that business owners can expect to own their land, buildings, machines, etc., and keep the majority of their profits, except for taxes. The profit incentive is a key driver of any free market system. The economies of the United States and other countries, such as Japan, are based on capitalism. However, a purely capitalistic economy is as rare as one that is purely communist. Imagine if a service such as police protection, one provided by the government in the United States, were instead allocated based on market forces. The ability to pay would then become a key determinant in who received these services, an outcome that few in American society would consider to be acceptable.
Mixed Market Economies
Though it is possible to have a pure communist system, or a pure capitalist (free market) system, in reality many economic systems are mixed market economies. A mixed market economy relies on both markets and the government to allocate resources. In practice, most economies are mixed, with a leaning towards either free market or socialistic principles, rather than being purely one or the other. Some previously communist economies, such as those of Eastern Europe and China, are becoming more mixed as they adopt more capitalistic characteristics and convert businesses previously owned by the government to private ownership through a process called privatization. By contrast, Venezuela is a country that has moved increasingly towards socialism, taking control of industries such as oil and media through a process called nationalization.
The Canadian Economic System
Like most countries, Canada features a mixed market system much like its neighbor to the south; though the Canadian and U.S. economic systems are primarily free market systems, the federal government controls some basic services, such as the postal service and air traffic control. The Canadian economy also has some characteristics of a socialist system, such as providing social security retirement benefits to retired workers or free health care to its population.
The free market system was espoused by Adam Smith in his book The Wealth of Nations, published in 1776. According to Smith, competition alone would ensure that consumers received the best products at the best prices. In the kind of competition he assumed, a seller who tries to charge more for his product than other sellers would not be able to find any buyers. A job-seeker who asks more than the going wage won’t be hired. Because the “invisible hand” of competition will make the market work effectively, there won’t be a need to regulate prices or wages. Almost immediately, however, a tension developed among free market theorists between the principle of laissez-faire—leaving things alone — and government intervention. Today, it is common for the Canadian government to intervene in the operation of the economic system. For example, the government exerts influence on the food and pharmaceutical industries through Canada’s Food and Drug Act and Regulations, which protect consumers by preventing unsafe or mislabeled products from reaching the market.
To appreciate how businesses operate, we must first get an idea of how prices are set in competitive markets. The next section, “Perfect Competition and Supply and Demand,” begins by describing how markets establish prices in an environment of perfect competition.
Explore the Concept: Indigenous Entrepreneurship and Economic Leakage
Economic development through resource extraction is an important tool for the creation of own-sourced revenue. To achieve long-term economic sustainability, however, it must be supported by community-appropriate business development. Various Indigenous communities authorize impact and benefit agreements with multi-national resource extraction corporations, doing so with the intention that the economic benefits will offset the resulting ethical and environmental concessions. In reality, the agreements often leave the communities in a similar socio-economic state before the resources were extracted, which is attributed to the phenomenon of economic leakage. Business development for Indigenous populations, on the other hand, refers to the strategic decision to produce and promote businesses for and within their own communities. Doing so would not only recapture economic leakage, but also provide additional revenue sources. Dr Russell Evans, the professor of accounting at the University of Windsor, offers his insight into the benefits of Indigenous entrepreneurship.[4]
Degrees of Competition
In economic theory and the broader discussion of competition, the “types” or “degrees” of competition refer to how firms compete in the market. These classifications focus on the market environment, not direct “business competition” (strategies businesses use to compete).
The Canadian economy is founded on the principles of private enterprise: private property rights, freedom of choice, profits, and competition. Under a mixed economy, such as we have in Canada, businesses make decisions about which goods to produce or services to offer and how they are priced. Because there are many businesses making goods or providing services, customers can choose from a wide array of products. The competition for sales among businesses is a vital part of our economic system. Competition varies within industries and has a big influence on how companies operate. Porter’s Five Forces model can be used to identify and analyze an industry’s competitive forces. The five forces are: threat of new entrants, threat of substitutes, bargaining power of buyers, bargaining power of suppliers, and rivalry among existing competitors.
As shown in Table 5.1 below, economists have identified four types of competition — perfect competition, monopolistic competition, oligopoly, and monopoly.
| Characteristic | Perfect Competition | Monopolistic Competition | Oligopoly | Pure Monopoly |
|---|---|---|---|---|
| Number of Firms | Very Many | Many | A Few | One |
| Types of Products | Homogeneous | Differentiated | Homogeneous or Differentiated | Homogeneous |
| Barriers to Entry or Exit from Industry | No Substantial Barriers | Minor Barriers | Considerable Barriers | Extremely Great Barriers |
| Examples | Agriculture | Retail Trade | Banking | Public Utilities |
Perfect Competition
Perfect competition is a market structure characterized by many buyers and sellers, homogeneous products, and no single participant having market power. Perfect competition exists when there are many consumers buying a standardized product from numerous small businesses. Because no seller is big enough or influential enough to affect the price, sellers and buyers accept the going price. For example, when a commercial fisher brings his fish to the local market, he has little control over the price he gets and must accept the going market price.
Supply and demand are central to the concept of perfect competition. In perfect competition, the price of goods and services is determined entirely by the interaction of supply and demand. High competition ensures that the supply curve (producers) and demand curve (consumers) interact freely without interference, such as monopolistic pricing or government controls. Producers can only compete on efficiency since prices cannot be manipulated, aligning the supply with the true demand.
Monopolistic Competition
In monopolistic competition, we still have many sellers (as we had under perfect competition). Now, however, they do not sell identical products. Instead, they sell differentiated products—products that differ somewhat, or are perceived to differ, even though they serve a similar purpose. Products can be differentiated in a number of ways, including quality, style, convenience, location, and brand name. Some people prefer Coke over Pepsi, even though the two products are quite similar. But what if there was a substantial price difference between the two? In that case, buyers could be persuaded to switch from one to the other. Thus, if Coke has a big promotional sale at a supermarket chain, some Pepsi drinkers might switch (at least temporarily).
How is product differentiation accomplished? Sometimes, it’s simply geographical; you probably buy gasoline at the station closest to your home, regardless of the brand. At other times, perceived differences between products are promoted by advertising designed to convince consumers that one product is different from and better than another. Regardless of customer loyalty to a product, however, if its price goes too high, the seller will lose business to a competitor. Under monopolistic competition, therefore, companies have only limited control over price.
Oligopoly
Oligopoly means a few sellers. In an oligopolistic market, each seller supplies a large portion of all the products sold in the marketplace. In addition, because the cost of starting a business in an oligopolistic industry is usually high, the number of firms entering it is low. Companies in oligopolistic industries include such large-scale enterprises as automobile companies and airlines. As large firms that supply a sizable portion of a market, these companies have some control over the prices they charge. But there’s a catch: because products are fairly similar, when one company lowers prices, others are often forced to follow suit to remain competitive. You see this practice all the time in the airline industry: When American Airlines announces a fare decrease, Continental, United Airlines, and others do likewise. When one automaker offers a special deal, its competitors usually come up with similar promotions.
Monopoly
In terms of the number of sellers and degree of competition, a monopoly lies at the opposite end of the spectrum from perfect competition. In perfect competition, there are many small companies, none of which can control prices; they simply accept the market price determined by supply and demand. In a monopoly, however, there’s only one seller in the market. The market could be a geographical area, such as a city or a regional area, and doesn’t necessarily have to be an entire country.
There are few monopolies in Canada because the government limits them. Most fall into one of two categories: natural and legal. Natural monopolies include public utilities, such as electricity and gas suppliers. Such enterprises require huge investments, and it would be inefficient to duplicate the products that they provide. They inhibit competition, but they’re legal because they’re important to society. In exchange for the right to conduct business without competition, they’re regulated. For instance, they can’t charge whatever prices they want; they must adhere to government-controlled prices. As a rule, they’re required to serve all customers, even if doing so isn’t cost-efficient.
A legal monopoly arises when a company receives a patent giving it exclusive use of an invented product or process. Patents are issued for a limited time, generally twenty years.[5] During this period, other companies can’t use the invented product or process without permission from the patent holder. Patents allow companies a certain period to recover the heavy costs of researching and developing products and technologies. A classic example of a company that enjoyed a patent-based legal monopoly is Polaroid, which for years held exclusive ownership of instant film technology.[6] Polaroid priced the product high enough to recoup, over time, the high cost of bringing it to market. Without competition, it enjoyed a monopolistic position in regard to pricing.
The Basics of Supply and Demand
To appreciate how perfect competition works, we need to understand how buyers and sellers interact in a market to set prices. In a market characterized by perfect competition, price is determined through the mechanisms of supply and demand. Prices are influenced both by the supply of products from sellers and by the demand for products by buyers. The law of supply and demand is an economic theory that explains how the relationship between supply and demand determines prices. When supply is greater than demand, prices fall, and when demand is greater than supply, prices rise.
To illustrate this concept, let us create a supply and demand schedule for one particular good sold at one point in time. Then we’ll define demand and create a demand curve, and define supply and create a supply curve. Finally, we’ll see how supply and demand interact to create an equilibrium price — the price at which buyers are willing to purchase the amount that sellers are willing to sell.
Demand and the Demand Curve
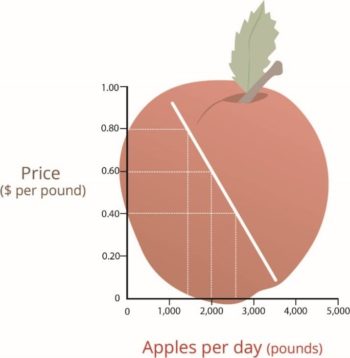
Demand is the quantity of a product that buyers are willing to purchase at various prices. The quantity of a product that people are willing to buy depends on its price. Consumers are typically willing to buy less of a product when prices rise and more of a product when prices fall. Generally speaking, we find products more attractive at lower prices, and we buy more at lower prices because our income goes further.
Using this logic, we can construct a demand curve that shows the quantity of a product that will be demanded at different prices. Let’s assume that Figure 5.4, “The Demand Curve,” represents the daily price and quantity of apples sold by farmers at a local market. Note that as the price of apples goes down, buyers’ demand goes up. Thus, if a pound of apples sells for $0.80, buyers will be willing to purchase only fifteen hundred pounds per day. But if apples cost only $0.60 a pound, buyers will be willing to purchase two thousand pounds. At $0.40 a pound, buyers will be willing to purchase twenty-five hundred pounds.
Factors that can affect demand include changes in income levels, population changes, consumer preferences, complementary goods, and substitute goods.
Supply and the Supply Curve
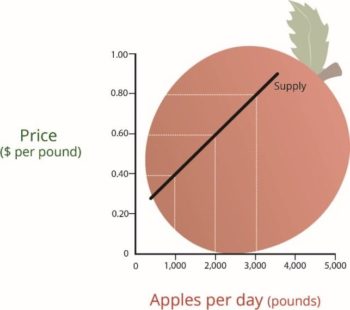
Supply is the quantity of a product that sellers are willing to sell at various prices. The quantity of a product that a business is willing to sell depends on its price. Businesses are more willing to sell a product when the price rises and less willing to sell it when prices fall. Again, this fact makes sense: businesses are set up to make profits, and there are larger profits to be made when prices are high.
Now we can construct a supply curve that shows the quantity of apples that farmers would be willing to sell at different prices, regardless of demand. As shown in Figure 5.5, “The Supply Curve”, the supply curve goes in the opposite direction from the demand curve: as prices rise, the quantity of apples that farmers are willing to sell also goes up. The supply curve shows that farmers are willing to sell only a thousand pounds of apples when the price is $0.40 a pound, two thousand pounds when the price is $0.60, and three thousand pounds when the price is $0.80.
Factors that affect supply include technological changes, changes in resource prices, price expectations, the number of suppliers, and the price of substitute goods.
Equilibrium Price
We can now see how the market mechanism works under perfect competition. We do this by plotting both the supply curve and the demand curve on one graph, as we have done in Figure 5.6. The Equilibrium Price” is the state in which market supply and demand balance each other; the point at which the two curves intersect.
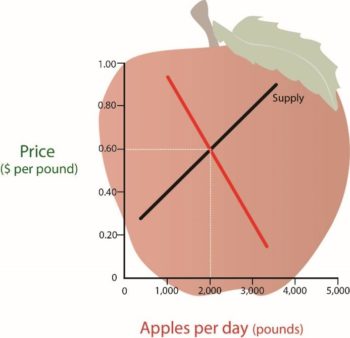
“The Equilibrium Price”, where the supply and demand curves intersect, is at the price of $0.60 and quantity of two thousand pounds. Thus, $0.60 is the equilibrium price. At this price, the quantity of apples demanded by buyers equals the quantity of apples that farmers are willing to supply. If a single farmer tries to charge more than $0.60 for a pound of apples, they won’t sell very many because other suppliers are making apples available for less. As a result, their profits will go down. If, on the other hand, a farmer tries to charge less than the equilibrium price of $0.60 a pound, they will sell more apples, but their profit per pound will be less than at the equilibrium price. With profit being the motive, there is no incentive to drop the price.
What have you learned in this discussion? Without outside influences, markets in an environment of perfect competition will arrive at an equilibrium point at which both buyers and sellers are satisfied. But you must be aware that this is a very simplistic example. Things are much more complex in the real world. For one thing, markets rarely operate without outside influences. Sometimes, sellers supply more of a product than buyers are willing to purchase; in that case, there’s a surplus. Sometimes, they don’t produce enough of a product to satisfy demand; then we have a shortage.
Circumstances also have a habit of changing. What would happen, for example, if incomes rose and buyers were willing to pay more for apples? The demand curve would change, resulting in an increase in the equilibrium price. This outcome makes intuitive sense: as demand increases, prices will go up. What would happen if apple crops were larger than expected because of favorable weather conditions? Farmers might be willing to sell apples at lower prices rather than letting part of the crop spoil. If so, the supply curve would shift, resulting in another change in equilibrium price: the increase in supply would bring down prices.
Measuring the Health of the Economy
Every day, we are bombarded with economic news (at least if you watch the business news stations). We are told about things like unemployment, home prices, and consumer confidence trends. As a student learning about business, and later as a business manager, you need to understand the nature of the Canadian economy and the terminology that we use to describe it. You need to have some idea of where the economy is heading, and you need to know something about the government’s role in influencing its direction.
Economic Goals
The world’s economies share three main goals:
- Growth
- High employment
- Price Stability
Let us take a closer look at each of these goals, both to find out what they mean and to show how we determine whether or not they’re being met.
Economic Growth
One purpose of an economy is to provide people with goods and services such as cars, computers, video games, houses, rock concerts, fast food, and amusement parks. One way in which economists measure the performance of an economy is by looking at a widely used measure of total output called the gross domestic product (GDP). The GDP is defined as the market value of all goods and services produced by the economy in a given year. The GDP includes only those goods and services produced domestically; goods produced outside the country are excluded. The GDP also includes only those goods and services that are produced for the final user; intermediate products are excluded. For example, the silicon chip that goes into a computer (an intermediate product) would not count directly because it is included when the finished computer is counted. By itself, the GDP doesn’t necessarily tell us much about the direction of the economy. But a change in the GDP does. If the GDP (after adjusting for inflation) goes up, the economy is growing. If it goes down, the economy is contracting. There is some debate amongst economists that GDP provides the most accurate measure of an economy’s performance. Many economists believe that GDP per capita, which is the measure of total production of goods and services divided by the number of households, is a better indicator of an economy’s performance. For example, according to The World Bank, as of 2017, India’s GDP ranked 7th in the world at $2.439 trillion (USD) while Canada’s GDP ranked 10th at $1.640 trillion (USD). However, as of 2017, Canada’s GDP per capita ranks 18th at $44,773 per household, compared to India’s GDP per capita, which ranked 142nd in the world at $1,852 per household.
Gross national product (GNP) is another metric used for measuring a nation’s economic output. Gross national product (GNP) is the value of all products and services produced by the citizens of a country, both domestically and internationally, minus income earned by foreign residents. For instance, if Canada has production facilities in the USA, its GNP will account for both the production output in Canada and the USA.
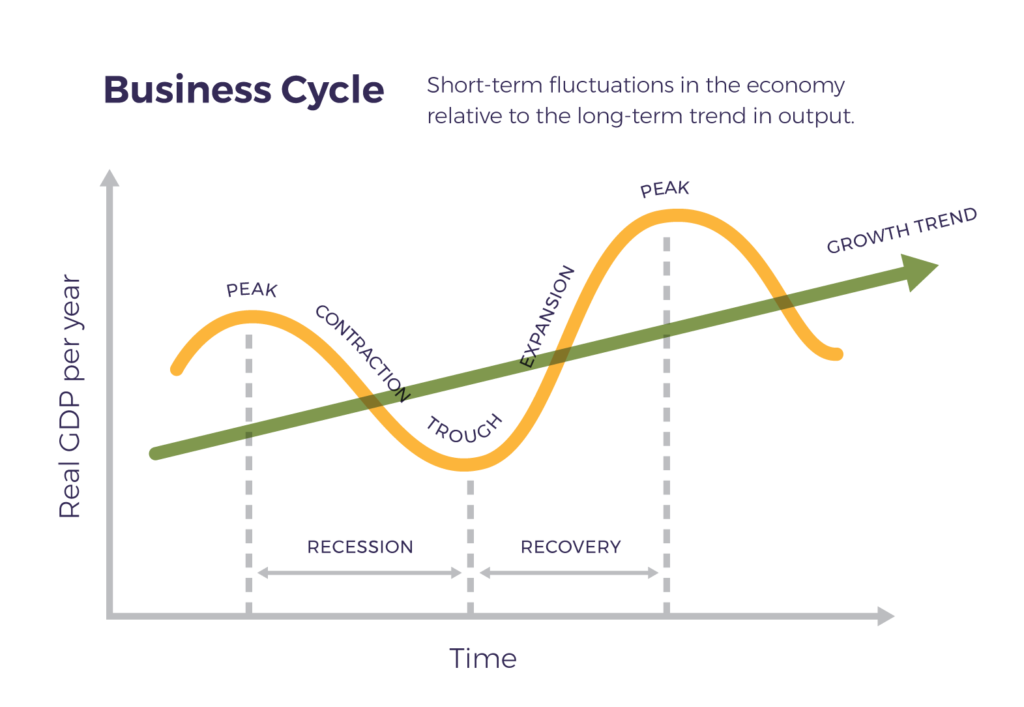
As shown in Figure 5.7, the economic ups and downs resulting from expansion and contraction constitute the business cycle (also referred to as the industry life cycle). Similar to a product lifecycle, as a business cycle introduces new products, those products grow, mature, and decline; when all business cycles in an economy are combined, an economy’s business cycle is created. A typical cycle runs from three to five years but could last much longer. Though typically irregular, a cycle can be divided into four general phases of prosperity, recession, depression (which the cycle generally skips), and recovery:
- During prosperity, the economy expands, unemployment is low, incomes rise, and consumers buy more products. Businesses respond by increasing production and offering new and better products.
- Eventually, however, things slow down. GDP decreases, unemployment rises, and because people have less money to spend, business revenues decline. This slowdown in economic activity is called a recession. Economists often say that we are entering a recession when GDP goes down for two consecutive quarters.
- Generally, a recession is followed by a recovery or expansion in which the economy starts growing again.
- If, however, a recession lasts a long time (perhaps a decade or so), while unemployment remains very high and production is severely curtailed, the economy could sink into a depression. While economists have defined recession, they have not agreed on a uniform standard for what constitutes a depression, though they are generally characterized by their duration. Though not impossible, it is unlikely that Canada will experience another severe depression like that of the 1930s. The federal government has several economic tools (some of which we’ll discuss shortly) with which to fight any threat of a depression.
If you want or need more interactive examples of the business cycle, this 10-minute Khan Academy video provides more details: The Business Cycle: Aggregate demand and aggregate supply.
High Employment
To keep the economy going strong, people must spend money on goods and services. A reduction in personal expenditures for things like food, clothing, appliances, automobiles, housing, and medical care could severely reduce GDP and weaken the economy. Because most people earn their spending money by working, an important goal of all economies is making jobs available to everyone who wants one. In principle, full employment occurs when everyone who wants to work has a job. In practice, we say that we have full employment when about 95 percent of those wanting to work are employed.
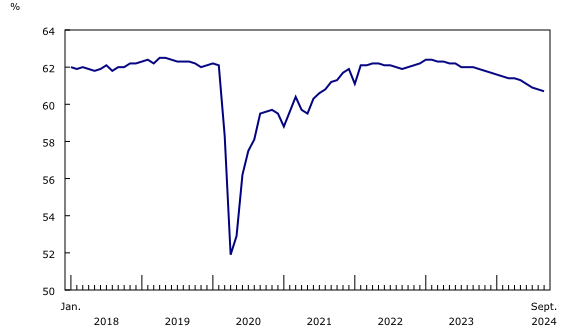
Refer to Figure 5.8, Statistics Canada Employment Rates. What might have caused employment rates to fall during the year 2020?
Unemployment
Statistics Canada tracks unemployment and reports the unemployment rate: the percentage of the labour force who are at least 15 years old that is unemployed and actively seeking work. The unemployment rate is an important measure of economic health. It goes up during recessionary periods because companies are reluctant to hire workers when demand for goods and services is low. Conversely, it goes down when the economy is expanding and there is high demand for products and workers to supply them. There are several different measures of unemployment because there are different reasons people may be unemployed, including:
- Frictional unemployment. Workers move between jobs and locations.
- Structural unemployment. Jobs are terminated.
- Cyclical unemployment. Impacted by the business cycle, when businesses may not have enough demand for labour.
- Seasonal unemployment. Jobs that occur during part of the year (e.g., snow plowing, beach-related industries).
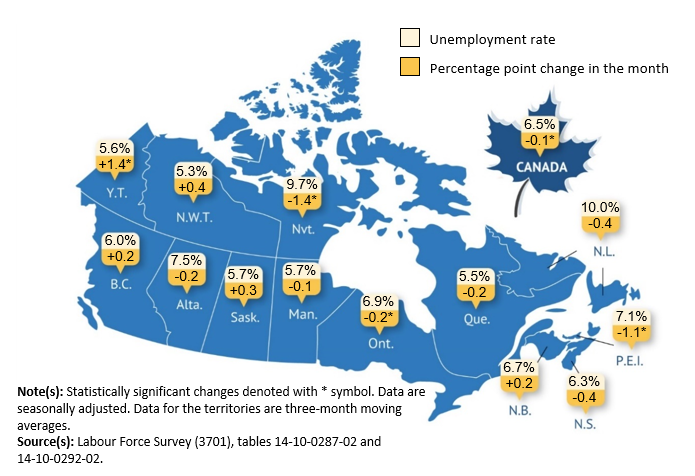
Figure 5.9 shows the Statistics Canada map of the unemployment rate by province and territory as of September 2024. Which province or territory has the highest unemployment rate? Why might that be?
Price Stability
A third major goal of all economies is maintaining price stability. Price stability occurs when the average price for goods and services either does not change or changes very little. Rapidly rising prices are troublesome for both individuals and businesses. For individuals, rising prices mean people have to pay more for the things they need. For businesses, rising prices mean higher costs, and, at least in the short run, businesses might have trouble passing on higher costs to consumers.
Inflation
When the overall price level goes up, we have inflation. More jobs and higher wages increase household incomes and lead to a rise in consumer spending, further increasing aggregate demand and the scope for firms to increase the prices of their goods and services. When this happens to a large number of businesses and sectors, this leads to an increase in inflation. Long-lasting episodes of high inflation are often the result of lax monetary policy.[7] If the money supply grows too big relative to the size of an economy, the unit value of the currency diminishes; in other words, its purchasing power falls and prices rise.[8]
Deflation
When the price level goes down (which rarely happens), we have deflation. A deflationary situation can also be damaging to an economy. When purchasers believe they can expect lower prices in the future, they may defer making purchases, which has the effect of slowing economic growth. Japan experienced a long period of deflation, which contributed to economic stagnation in that country, from which it is only now beginning to recover.
The Consumer Price Index (CPI)
The most widely publicized measure of inflation is the consumer price index (CPI), which is reported monthly by Statistics Canada. The consumer price index (CPI) measures the rate of inflation by determining price changes of a hypothetical basket of goods, such as food, housing, clothing, medical care, appliances, automobiles, and so forth, bought by a typical household.
The Bank of Canada currently measures prices against the base year of 2002, and the basket for that year is given the value of 100. In 2012, the CPI averaged $121, which means that what you could buy for $100 in 2002 cost $121.70 in 2012. The difference registers the effect of inflation. In fact, that’s what an inflation rate is—the percentage change in a price index.
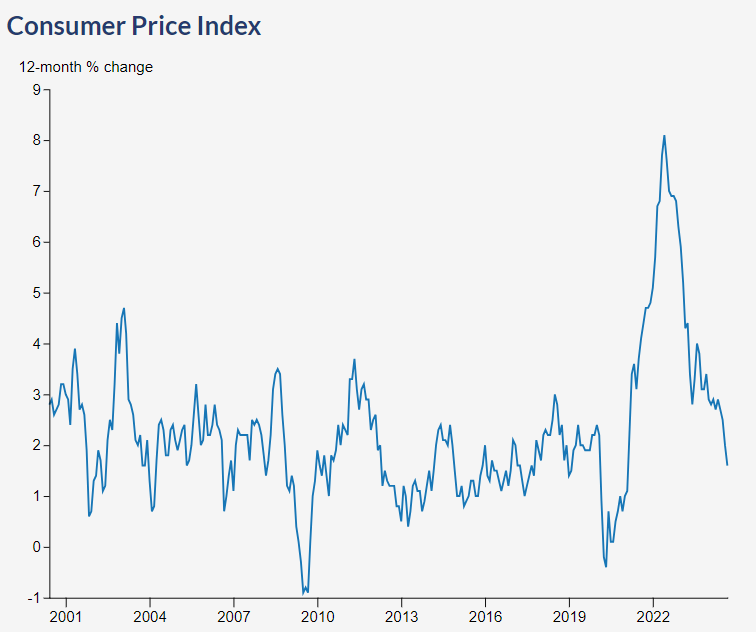
The Bank of Canada created an Inflation Calculator to compare the costs of consumer goods then and now. For example, ask a parent or an older neighbour what they paid for their first car, first house, or first formal wear. Observe Figure 5.10 showing the consumer price index for the years 2000 to 2024. Why do you think there is a huge increase in the CPI during 2022? What happened in the world to cause this?
The CPI measures change in prices of consumer goods and does not measure change in prices of goods used to create consumer goods, such as capital and resource expenditures. The producer price index (PPI) tracks the average change in prices at the wholesale level (e.g., raw materials, product components that require further processing, and finished goods sold to retailers).
Economic Forecasting
In the previous section, we introduced several measures that economists use to assess the performance of the economy at a given time. By looking at changes in the GDP, for instance, we can see whether the economy is growing. The CPI allows us to gauge inflation. These measures help us understand where the economy stands today. But what if we want to get a sense of where it’s headed in the future? To a certain extent, we can forecast future economic trends by analyzing several leading economic indicators.
Leading, Coincident, and Lagging Economic Indicators
In economics, leading, lagging, and coincident indicators are tools used to analyze and predict economic performance. These indicators help economists, policymakers, and businesses make informed decisions about the state of the economy and potential future trends. An economic indicator is a statistic that provides valuable information about the economy. There’s no shortage of economic indicators, and trying to follow them all would be an overwhelming task. So, in this chapter, we will only discuss the general concept and a few of the key indicators.
Canadian economic indicators can be expressed in three main indicators — leading indicators, coincident indicators and lagging indicators.
Leading Indicators
These indicators signal future economic activity and are used to predict changes in the economy before they occur. For example, stock prices often reflect investor sentiments about future economic conditions. An increase in building permits suggests future growth in the construction and housing markets. On the consumer confidence index, higher confidence indicates likely increases in spending, boosting economic activity. An increase in new orders for manufacturing indicates increased production and economic growth. Businesses and policymakers monitor these changes to anticipate expansions or contractions in the economy.
New unemployment claims often reflect employers’ expectations about future economic conditions. If businesses anticipate a slowdown, they may lay off workers, leading to an increase in claims. This data provides an early signal of weakening economic activity or labor market challenges. Economists and policymakers monitor changes in unemployment claims to predict potential recessions or recoveries. For example, a sustained rise in claims could indicate an impending economic downturn, prompting proactive policy adjustments such as monetary easing or fiscal stimulus.
Lagging Indicators
These indicators reflect changes that have already occurred in the economy. They confirm trends but do not predict them. For example, changes in unemployment often lag behind economic trends as businesses adjust to economic shifts. Rising consumer debt levels confirm past high spending levels during an economic boom. The inflation rate typically reacts to earlier changes in supply, demand, and monetary policy. These indicators are useful for validating the accuracy of leading indicators and understanding the economy’s historical performance.
The length of unemployment is also a lagging indicator. If unemployed workers have remained out of work for a long time, we may infer that the economy has been slow. Indicators that predict the status of the economy three to twelve months into the future are called leading economic indicators. If such an indicator rises, the economy is more likely to expand in the coming year. If it falls, the economy is more likely to contract.
Coincident Indicators
These indicators move in real-time with the economy, reflecting its current state. Gross Domestic Product (GDP) directly shows the economic output at a given time. Employment levels indicate current labour market conditions. Retail sales reflect ongoing consumer spending trends. Industrial production measures real-time manufacturing activity. These indicators provide a snapshot of the present economic situation and are helpful for short-term planning.
Since employment is such a key goal in any economy, the Canadian Industry Statistics, in collaboration with Statistics Canada, tracks total non-farm payroll employment from which the number of net new jobs created can be determined. The number of new jobs created is considered a coincident indicator in economics. New job creation reflects current economic activity and labor market conditions. It shows how businesses are responding to the existing economic climate by expanding their workforce, which aligns with the economy’s present state rather than predicting future trends. A rise in new jobs typically coincides with economic growth, indicating healthy consumer demand and business investment. Conversely, a decline in new jobs suggests slower economic activity or contraction.
Understanding the differences between these indicators is crucial:
- Businesses might use leading indicators to forecast demand and adjust production.
- Governments use lagging indicators to assess the effectiveness of policies.
- Both rely on coincident indicators for immediate economic health assessments.
Government’s Role in Managing the Economy
The Canadian government, including federal, provincial, and municipal governments, plays many roles within the Canadian economic system and therefore influences business activities. The government plays many roles and influences business activities in many ways. The roles the government plays are as follows:
- Customer – Purchases goods and services from businesses (e.g., infrastructure projects, equipment).
- Competitor – Operates Crown corporations (e.g., Canada Post) that may compete with private businesses.
- Regulator – Enforces laws and regulations that promote competition, protect consumers, and ensure environmental and social responsibility.
- Taxation Agent – Collects taxes to fund public programs and infrastructure.
- Provider of Incentives – Offers subsidies, tax credits, and grants to stimulate specific industries or investments.
- Protector of Consumers – Sets quality and safety standards for goods, services, and business practices.
- Provider of Essential Services – Delivers healthcare, education, transportation, and emergency services.
Businesses may also attempt to influence government decisions through lobbying, trade associations, political contributions, and public advocacy.
To manage the broader economy, the government uses three primary tools: Monetary Policy, Fiscal Policy, and National Debt Management.
Monetary Policy and The Bank of Canada
Monetary policy is exercised by the Bank of Canada, which is empowered to take various actions that decrease or increase the money supply and raise or lower short-term interest rates, making it harder or easier to borrow money.
The Role of the Bank of Canada

The Bank of Canada is the nation’s central bank. Its principal role is “to promote the economic and financial welfare of Canada,” as defined in the Bank of Canada Act. The Bank of Canada is a special type of Crown corporation that is owned by the federal government but has considerable independence to carry out its responsibilities and therefore operates separately from the political process. The Bank of Canada is led by the Governing Council, the policy-making body of the Bank, which is responsible for conducting monetary policy and promoting a safe and efficient financial system.
The Governing Council is made up of the Governor, the Senior Deputy Governor, and the Deputy Governors. The Governing Council’s main tool for conducting monetary policy is the target for the overnight rate (also known as the key policy rate). This rate is normally set on eight fixed announcement dates per year. The Council reaches its decisions about the rate by consensus, rather than by individual votes, as is the case at some other central banks.
The Bank’s four main areas of responsibility are:[9]
- Monetary policy: The Bank influences the supply of money circulating in the economy, using its monetary policy framework to keep inflation low and stable.
- Financial systems: The Bank promotes safe, sound, and efficient financial systems, within Canada and internationally, and conducts transactions in financial markets in support of these objectives.
- Currency: The Bank designs, issues, and distributes Canada’s bank notes.
- Funds management: The Bank is the fiscal agent for the Government of Canada, managing its public debt programs and foreign exchange reserves.
Tools for Monetary Policy
The Bank of Canada uses two main tools to conduct monetary policy:
1. Bank Rate
The bank rate is the interest rate the Bank of Canada charges commercial banks for short-term loans. It serves as a benchmark for other interest rates in the country.
- Lowering the bank rate makes borrowing cheaper, encouraging spending and investment.
- Raising the bank rate makes borrowing more expensive, helping to reduce inflation.
2. Open Market Operations (OMO)
These operations involve buying or selling government securities (bonds) in the financial markets to manage the money supply.
- Expansionary Policy (During Recession):
- The Bank buys government bonds from banks and investors.
- This puts more money into circulation, increasing the reserves of commercial banks.
- With more money to lend, interest rates decrease, encouraging borrowing and spending.
- Contractionary Policy (During Inflation):
- The Bank sells government bonds, which pulls money out of circulation.
- Commercial banks use their reserves to purchase these bonds, reducing their ability to lend.
- This makes money more expensive to borrow, which helps reduce demand and slow inflation.
The Bank of Canada plays a vital role in managing the money supply in Canada. If the Bank of Canada wants to increase the money supply, it can buy government securities. The individuals and investors who sell these bonds then deposit the proceeds in their banks. These deposits increase banks’ reserves and their willingness to make loans. The Bank of Canada can also lower the bank rate; this action will cause increased demand for loans from businesses and households because these customers borrow more money when interest rates drop.
If the Bank of Canada wants to decrease the money supply, it can sell government securities. Individuals and investors spend money to buy bonds, and these withdrawals bring down banks’ reserves and reduce their willingness to make loans. The Bank of Canada can also raise the bank rate; this action will decrease the demand for loans from businesses and households because these customers borrow less money when interest rates rise.
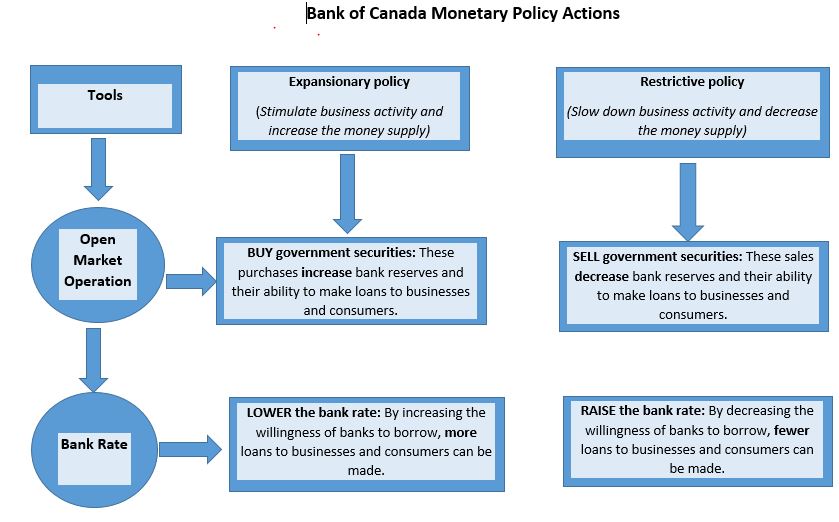
The Bank of Canada will typically decrease the money supply during inflationary periods, making it harder to borrow money. As shown in Figure 5.11, when the Bank of Canada believes that inflation is a problem, it will use contractionary policy to decrease the money supply and raise interest rates. When rates are higher, borrowers have to pay more for the money they borrow, and banks are more selective in making loans. Because money is “tighter” — more expensive to borrow — demand for goods and services will go down, and so will prices. In any case, that’s the theory.
To counter a recession, the Bank of Canada uses expansionary policy to increase the money supply and reduce interest rates. With lower interest rates, it’s cheaper to borrow money, and banks are more willing to lend it. We then say that money is “easy.” Attractive interest rates encourage businesses to borrow money to expand production and encourage consumers to buy more goods and services. In theory, both sets of actions will help the economy escape or come out of a recession.
Fiscal Policy
Fiscal policy relies on the government’s powers of spending and taxation. Both taxation and government spending can be used to reduce or increase the total supply of money in the economy — the total amount, in other words, that businesses and consumers have to spend.
Below are a few key points:
- Taxation as a tool. The federal government adjusts taxes (e.g., income tax, corporate tax, GST) to influence economic activity. For instance, tax cuts may be implemented to stimulate consumer spending and investment during economic downturns. When the country is in a recession, government policy is typically to increase spending, reduce taxes, or both. Such expansionary actions will put more money in the hands of businesses and consumers, encouraging businesses to expand and consumers to buy more goods and services. Expansionary fiscal policy is used to increase government expenditures and/or decrease taxes, which causes the government’s budget deficit to increase or its budget surplus to decrease. When the economy is experiencing inflation, the opposite policy is adopted: the government will decrease spending or increase taxes, or both. Because such contractionary measures reduce spending by businesses and consumers, prices come down and inflation eases. Contractionary fiscal policy is used to decrease government expenditures and/or increase taxes, which causes the government’s budget deficit to decrease or its budget surplus to increase.
- Government spending. Public expenditures on infrastructure, healthcare, education, and social programs are critical components of fiscal policy. Increased spending during economic slowdowns can boost demand and promote growth, while spending reductions may help curb inflation.
- Budget management. Canada’s fiscal policy balances between deficits and surpluses. During recessions, deficits may increase due to stimulus measures, whereas in economic booms, surpluses help reduce national debt.
- Targeted economic support. Programs like the Canada Child Benefit (CCB) or pandemic relief measures (e.g., CERB) reflect the use of fiscal policy to address specific societal or economic challenges and support vulnerable populations.
The National Debt
The national debt is also referred to as Canada’s public debt. According to the Department of Finance Canada, Government Debt in Canada increased to 1134.49 CAD Billion in 2022 from 1048.75 CAD Billion in 2021. The expected rise was due to the massive new borrowing to cover COVID-19 pandemic responses. You can check the current debt at Canadian National Debt Clock.
If, in any given year, the government takes in more money (through taxes) than it spends on goods and services (for things such as defense, transportation, and social services), the result is a budget surplus. If, on the other hand, the government spends more than it takes in, we have a budget deficit (which the government pays off by borrowing through the issuance of Treasury bonds). Historically, deficits have occurred much more often than surpluses; typically, the government spends more than it takes in.
Below are a few key facts:
- Federal debt levels. As of the 2023-2024 fiscal year, Canada’s federal net debt has risen to approximately $1.33 trillion, reflecting a significant increase from pre-pandemic levels. This surge includes the impacts of COVID-19 relief measures and ongoing fiscal policies.[10]
- Combined federal-provincial debt. When combining federal and provincial levels, the total net debt reached approximately $2.18 trillion in 2023/24. The debt-to-GDP ratio for federal and provincial governments collectively has risen from 65.7% in 2019/20 to 76.2% in 2023/24.
- [11]
- Debt per capita. On average, each Canadian is responsible for approximately $33,682 in federal debt. Provincial variations exist, with Newfoundland and Labrador having the highest per capita debt at $32,561, followed by Ontario at $27,091.
- [12]
- Projected growth. Federal debt is expected to increase further, with projections reaching $1.49 trillion by 2028/29. Efforts are being made to manage debt servicing costs, which currently remain stable at 1.8% of GDP, despite rising interest rates.[13]
The Functions of Money
Money Characteristics

If you happen to have one on you, take a look at a $5 bill. Though this piece of paper — indeed, money itself — has no intrinsic value, it is certainly in demand. Why? Because money serves three basic functions:
- a medium of exchange;
- a measure of value; and
- a store of value.
To get a better idea of the role of money in a modern economy, let us imagine a system in which there is no money. In this system, goods and services are bartered — traded directly for one another. Now, if you are living and trading under such a system, for each barter exchange that you make, you will have to have something that another trader wants. For example, say you are a farmer who needs help clearing his fields. Because you have plenty of food, you might enter into a barter transaction with a laborer who has time to clear fields but not enough food: he’ll clear your fields in return for three square meals a day. This system will work as long as two people have exchangeable assets, but needless to say, it can be inefficient. If we identify the functions of money, we will see how it improves the exchange for all the parties in our hypothetical set of transactions.
Money is anything that is acceptable as payment for goods and services. It affects our lives in many ways. We earn it, spend it, save it, invest it — and often wish we had more of it. Businesses and the government use money in similar ways. Both require money to finance their operations. By controlling the amount of money in circulation, the federal government can promote economic growth and stability. For this reason, money has been called the lubricant of the machinery that drives our economic system. Our banking system was developed to ease the handling of money.
Medium of Exchange
Money serves as a medium of exchange because people will accept it in exchange for goods and services. Because people can use money to buy the goods and services that they want, everyone’s willing to trade something for money. The laborer will take money for clearing your fields because he can use it to buy food. You’ll take money as payment for his food because you can use it not only to pay him but also to buy something else you need (perhaps seeds for planting crops).
For money to be used in this way, it must possess a few crucial properties:
- It must be divisible — easily divided into usable quantities or fractions. A $5 bill, for example, is equal to five $1 bills. If something costs $3, you don’t have to rip up a $5 bill; you can pay with three $1 bills.
- It must be portable — easy to carry; it can’t be too heavy or bulky.
- It must be durable — strong enough to resist tearing, and the print can’t wash off if it winds up in the washing machine.
- It must be difficult to counterfeit — it won’t have much value if people can make their own.
Measure of Value
Money simplifies exchanges because it serves as a measure of value. We state the price of a good or service in monetary units so that potential exchange partners know exactly how much value we want in return for it. This practice is a lot better than bartering because it’s much more precise than an ad hoc agreement that a day’s work in the field has the same value as three meals.
Store of Value
Money serves as a store of value. Because people are confident that money keeps its value over time, they’re willing to save it for future exchanges. Under a bartering arrangement, the laborer earned three meals a day in exchange for his work. But what if, on a given day, he skipped a meal? Could he “save” that meal for another day? Maybe, but if he were paid in money, he could decide whether to spend it on food each day or save some of it for the future. If he wanted to collect his unpaid meal two or three days later, the farmer might not be able to pay it; unlike money, food could go bad.
The Money Supply
Now that we know what money does, let us tackle another question: how much money is there? How would you go about “counting” all the money held by individuals, businesses, and government agencies in this country? You could start by counting the money that’s held to pay for things daily. This category includes cash (paper bills and coins) and funds held in demand deposits — chequing accounts, which pay given sums to “payees” when they demand them.
Then, you might count the money that is being “saved” for future use. This category includes interest-bearing accounts, time deposits (such as certificates of deposit, which pay interest after a designated period of time), and money market mutual funds, which pay interest to investors who pool funds to make short-term loans to businesses and the government.
M-1, M-2 and M3
Counting all this money would be a daunting task (in fact, it would be impossible). Fortunately, there’s an easier way — namely, by examining two measures that the government compiles for the purpose of tracking the money supply: M-1 and M-2.
- M-1 is the narrowest measure, and it includes the most liquid forms of money — the forms, such as cash and chequing account funds, which are spent immediately.
- M-2 includes everything in M-1 plus near-cash items invested for the short term — savings accounts, time deposits and money market mutual funds.
- Canada Money Supply M3 includes M2 plus long-term time deposits in banks.
M-3 money in Canada refers to a broad measure of the money supply that includes M-2 (which itself comprises M-1, demand deposits, and savings accounts) and adds components like large time deposits, institutional money market funds, short-term repurchase agreements, and other liquid financial instruments. This measure provides insights into the overall liquidity in the economy, encompassing funds that are less readily accessible but still significant for economic activities. M-3 is particularly useful for analyzing broader economic trends, such as inflation, as it includes assets closer to “near-money” and reflects overall financial stability and potential consumer spending capabilities. This category is sometimes referred to as “broad money.”
How much money is out there? The Bank of Canada reports that as of July 2023, M-1 totalled $1,510,782 CAD Million (approximately $1,111.114 B USD), M-2 totalled $2,423,488 CAD Million (approximately $1,782.37 B USD), and M-3 totalled $3,493,917 CAD Million (approximately $2,569.623 B USD).[14]
What Exactly Is “Plastic Money”?
Are credit cards a form of money? If not, why do we call it plastic money? When you buy something with a credit card, you are not spending money. The principle of the credit card is buy-now-pay-later. In other words, when you use plastic, you are taking out a loan that you intend to pay off when you get your bill. And the loan itself is not money. Why not? Basically, because the credit card company cannot use the asset to buy anything. The loan is merely a promise of repayment. The asset does not become money until the bill is paid (with interest). That is why credit cards are not included in the calculation of M-1 and M-2.
International Banking Structure
Policymaking and regulatory powers are different in every nation; local standards and laws also vary greatly, which means that banking systems vary greatly. These two United Nations agencies — the World Bank and the International Monetary Fund — assist in financing international trade.
The World Bank
The World Bank is an important source of economic assistance for poor and developing countries. With backing from wealthy donor countries (such as Canada, the United States, Japan, Germany, and the United Kingdom), the World Bank provides loans, grants, and guarantees to some of the world’s poorest nations. Loans are made to help countries improve the lives of the poor through community support programs designed to provide health, nutrition, education, infrastructure, and other social services.
The International Monetary Fund
The International Monetary Fund (IMF) is governed by and accountable to its 191 member countries and has three critical missions: furthering international monetary cooperation, encouraging the expansion of trade and economic growth, and discouraging policies that would harm prosperity.[15]
These countries combine their resources to:
- Encourage the development of a system for international payments
- Promote the stability of exchange rates
- Provide temporary, short-term loans to member countries
- Encourage members to cooperate on international monetary issues
The IMF loans money to countries with troubled economies, such as Mexico in the 1980s and mid-1990s, and Russia and Argentina in the late 1990s. There are, however, strings attached to IMF loans; in exchange for relief in times of financial crisis, borrower countries must institute sometimes painful financial and economic reforms. In the 1980s, for example, Mexico received financial relief from the IMF on the condition that it privatize and deregulate certain industries and liberalize trade policies. The government was also required to cut back expenditures for such services as education, health care, and workers’ benefits.
Some nations have declined IMF funds rather than accept the economic changes that the IMF demands. In 2021, according to the IMF website, the IMF had about $1 trillion available for loans. Even though the U.S. has been instrumental in promoting global free trade for decades in 2018, it was rumoured that under Trump’s administration, the U.S. would withdraw from the World Trade Organization (WTO). This did not happen, but the instability caused by such news was damaging to the WTO.
Canadian Banks In The International Marketplace
The financial marketplace spans the globe, with money routinely flowing across international borders. Canadian banks play an important role in global business by providing loans to foreign governments and businesses. Multinational corporations need many special banking services, such as foreign currency exchange and funding for overseas investments. Canadian banks also offer trade-related services, such as global cash management, which help firms manage their cash flow, improve their payment efficiency, and reduce their exposure to operational risks. Sometimes, consumers in other nations have a need for banking services that banks in their own countries do not provide. Therefore, large banks often look beyond their national borders for profitable banking opportunities.
Foreign funding has been crucial to Canada’s economic development, with the Canadian capital market being an integral part of the international capital market. Canadian provinces often secure financing in foreign markets like London and New York, and projections suggest that foreign capital will remain essential to meeting Canada’s future financial needs.
Some Canadian banks have established a presence in overseas markets, opening offices in Europe, Latin America, and Asia. These banks often offer superior customer service compared to local institutions and have access to diverse funding sources. However, international expansion poses challenges. Canadian banks face competition from foreign institutions that operate under less stringent regulations, enabling them to offer more competitive pricing. Some governments also protect domestic banks by restricting foreign competition. For instance, in China, foreign banks face high fees, deposit limits, and interest rate controls, which favor government-owned Chinese banks. Despite these obstacles, certain Canadian banks continue to do business in China.[16]
International banks operating in Canada significantly contribute to the economy by creating jobs, paying taxes, and making operational and capital investments. Most employees in these institutions are Canadian citizens, further supporting the domestic workforce.
Nonetheless, international banking carries risks, including political and economic instability. The financial crisis of 2007–2009 highlighted these vulnerabilities, with countries such as Greece, Portugal, Spain, and Ireland experiencing severe economic disruptions. Recovery in these nations has been slow, but financial assistance from the European Union and the International Monetary Fund has played a critical role in stabilizing both regional and global economies.
Currency Values and Exchange Rates
Currencies are traded in the foreign exchange market. Like any other market, when something is exchanged, there is a price. In the foreign exchange market, a currency is bought and sold, and the price of that currency is given in some other currency. That price is expressed as an exchange rate.
When an exchange rate changes, the value of one currency will go up while the value of the other currency will go down. When the value of a currency increases, it is said to have appreciated. On the other hand, when the value of a currency decreases, it is said to have depreciated.
The Canadian dollar fluctuates against the American dollar between a 65-70 per cent range. In November 2007, the CAD dollar was stronger than the US dollar, at US $1.09. After a few years of parity, the Canadian dollar retreated to approximately US $0.76 in June 2018.[17] These fluctuations have an impact on businesses.
International Payment Process
International financial settlements between buyers and sellers are different in many countries. Canadian banks provide services to buyers and sellers to support their clients during global financial transactions. Country-to-country transactions rely on an international payment process that moves money between buyers and sellers in different countries. For example, payment from a Canadian buyer starts at a local bank that converts funds from dollars into the seller’s currency, say British pounds sterling, to be sent to a seller in England. At the same time, payments and currency conversions from separate transactions are also flowing between British businesses and Canadian sellers in the other direction. A balanced trade between the two countries implies that money inflows and outflows are equal for both countries. If inflows and outflows are not in balance at the Canadian bank or the British bank, then a flow of money, either to England or Canada, is made to cover the difference.
Digital Currencies

Digital currencies are currencies that are only accessible with computers or mobile phones because they only exist in electronic form. Digital money is not physically tangible like a dollar bill or a coin. It is accounted for and transferred using online systems. The difference between digital currencies and cryptocurrencies is that digital currencies are centralized, meaning that transaction within the network is regulated in a centralized location, like a bank. Cryptocurrencies are mostly decentralized, and the regulations inside the network are governed by the majority of the community.
The Bank of Canada revealed in 2016 that it was developing the CAD-coin as a digital version of the Canadian dollar, a move in response to the rise in popularity of bitcoin and other blockchain-based digital currencies. The initiative will involve issuing, transferring, and settling the central bank’s monetary assets by way of a computerized ledger rather than by way of printed dollars. Research and experiments have been ongoing since 2016. Some major banks in Canada are participating in this new initiative, including Royal Bank of Canada, CIBC, and TD Bank Group, and institutional partners such as Payments Canada and TMX Group.
Despite their claim of being the money of the future, current private digital currencies, like Bitcoin, do not work well for making payments or saving for the future. Because of their fluctuating values and slow clearing times, very few merchants accept them. It is possible that in the future, digital currencies could at least partially solve these problems, leading to greater adoption. But widespread adoption of private digital currencies would carry important risks to both the economy and the financial system. The issuer could go out of business or fall victim to cybertheft; either situation could cause a loss of confidence in the payment system.
Exploring the idea of a central bank digital currency makes sense. In theory, it could provide the safety of cash, with the convenience of modern electronic payments. It could take many forms, but two broad approaches are:
- value-based — people transfer money from their bank account to a card or a phone app; or
- account-based — people or businesses open accounts at the central bank.
Either way, payments made using a central bank digital currency could allow payments to remain private to the parties involved, just like cash, but traceable to law enforcement, just like bank accounts.
Central bank digital currencies could give consumers more choice while maintaining competition among financial service providers like banks, the way cash does now. Depending on their design, they could even act as a backup if other payment methods become temporarily unavailable.
Basically, central bank digital cash would act like current electronic payment methods, the only difference being that it would not be tied to a commercial bank the way bank accounts and debit cards are.[18]
Key Takeaways
- Economics is the study of how individuals, businesses, governments, and nations allocate their limited resources to satisfy their unlimited wants and needs. It is how a society uses scarce resources to produce and distribute goods and services. The resources of a person, a firm, or a nation are limited, and in economics, this limitation is known as scarcity.
- In Canada, the government and the free-market system guide the economy together.
- Microeconomics is the study of individuals and business decisions. Macroeconomics looks at the decisions of countries and governments. These two branches of economics appear to be different but in reality, they’re interdependent and complement each other.
- Resources are the inputs used to produce outputs. The circular flow model is simply a way of depicting how money circulates through the economy from individuals to firms in the form of labor and buying goods and services. Then, from firms to individuals in the form of wages, and providing goods/services.
- Productivity refers to how efficiently goods and services are produced.
- A free market economy is an economic system where the laws of supply and demand determine prices, and the government has limited or no involvement. People decide how to use factors of production, such as land, labor, capital, and physical resources. In a market economy, producers decide what to produce, how much to charge, and what to sell.
- A mixed economy is an economic system where some resources are planned for by the government, while citizens control others. The world’s dominant economic organization is a mixed economy.
- A planned economy is a system where the state determines production levels and regulates prices. In a centrally planned economy, the state uses advanced planning mechanisms to determine production levels, rather than supply and demand.
- Capitalism is an economic system that promotes the creation and ownership of capital and wealth. A free market system is a capitalist system that focuses on the unfettered exchange of goods and services, with little or no interference by the government.
- Socialism is an economic and political system where the means of production are owned by the public or the state, rather than private individuals. It’s based on the idea that shared ownership of resources leads to a more equal society. Socialism is generally considered a planned economy, where the government controls the production of goods and services, rather than a market economy.
- Communism is a political and economic system that aims to eliminate class struggles by having the public own the means of production, such as factories and mines. In a communist society, there is no private property or currency, and wealth is shared equally or based on need. Communism is not the same as a planned economy, but communism is often associated with centrally planned economies.
- Economists generally agree there are four different degrees of competition: 1) perfect competition, 2) monopolistic competition, 3) oligopoly, and 4) monopoly. Porter’s Five Forces model is used to identify and analyze an industry’s competitive forces. Perfect competition exists when there are many consumers buying a standardized product from numerous small businesses. In monopolistic competition, we still have many sellers (as we had under perfect competition). Now, however, they do not sell identical products. Oligopoly means a few sellers. In an oligopolistic market, each seller supplies a large portion of all the products sold in the marketplace. In terms of the number of sellers and degree of competition, a monopoly lies at the opposite end of the spectrum from perfect competition.
- The law of supply and demand is an economic theory that explains how the relationship between supply and demand determines prices. When supply is greater than demand, prices fall, and when demand is greater than supply, prices rise.
- Supply is the quantity of a product that sellers are willing to sell at various prices. The quantity of a product that a business is willing to sell depends on its price.
- Demand is the quantity of a product that buyers are willing to purchase at various prices. The quantity of a product that people are willing to buy depends on its price.
- The Equilibrium Price is the state in which the market supply and demand balance each other.
- The world’s economies share three main goals: growth, high employment, and price stability. Economists measure the performance of an economy by looking at GDP, GNP, and other measures.
- The GDP is defined as the market value of all goods and services produced by the economy in a given year.
- Gross national product (GNP) is the value of all products and services produced by the citizens of a country, both domestically and internationally,y minus income earned by foreign residents.
- The economic ups and downs resulting from expansion and contraction constitute the business cycle (also referred to as the industry life cycle). During prosperity, the economy expands, unemployment is low, incomes rise, and consumers buy more products. A slowdown in economic activity is called a recession. A recession is followed by a recovery or expansion in which the economy starts growing again. If, however, a recession lasts a long time (perhaps a decade or so), while unemployment remains very high and production is severely curtailed, the economy could sink into a depression.
- Statistics Canada tracks unemployment and reports the unemployment rate: the percentage of the labour force who are at least 15 years old that is unemployed and actively seeking work.
- Price stability occurs when the average price for goods and services either does not change or changes very little. When the overall price level goes up, we have inflation. When the price level goes down (which rarely happens), we have deflation.
- The consumer price index (CPI) measures the rate of inflation by determining price changes of a hypothetical basket of goods, such as food, housing, clothing, medical care, appliances, automobiles, and so forth, bought by a typical household.
- The producer price index (PPI) tracks the average change in prices at the wholesale level (e.g., raw materials, product components that require further processing, and finished goods sold to retailers).
- Monetary policy is exercised by the Bank of Canada, which is empowered to take various actions that decrease or increase the money supply and raise or lower short-term interest rates, making it harder or easier to borrow money.
- Fiscal policy relies on the government’s powers of spending and taxation. Both taxation and government spending can be used to reduce or increase the total supply of money in the economy — the total amount, in other words, that businesses and consumers have to spend.
- The national debt is also referred to as Canada’s public debt. According to the Department of Finance Canada, Government Debt in Canada increased to 1134.49 CAD Billion in 2022 from 1048.75 CAD Billion in 2021.
- Money is anything that is acceptable as payment for goods and services. For money to be used as a medium of exchange, it must be divisible, portable, durable, and difficult to counterfeit. M-1 is the narrowest measure, and it includes the most liquid forms of money — the forms, such as cash and chequing account funds, which are spent immediately. M-2 includes everything in M-1 plus near-cash items invested for the short term — savings accounts, time deposits, and money market mutual funds.
- The Bank of Canada’s four main areas of responsibility are: monetary policy, financial systems, currency, and funds management.
- The World Bank is an important source of economic assistance for poor and developing countries. With backing from wealthy donor countries (such as Canada, the United States, Japan, Germany, and the United Kingdom), the World Bank provides loans, grants, and guarantees to some of the world’s poorest nations.
- The International Monetary Fund (IMF) is governed by and accountable to its 191 member countries and has three critical missions: furthering international monetary cooperation, encouraging the expansion of trade and economic growth, and discouraging policies that would harm prosperity.
- Currencies are traded in the foreign exchange market. Like any other market, when something is exchanged, there is a price. In the foreign exchange market, a currency is bought and sold, and the price of that currency is given in some other currency. That price is expressed as an exchange rate.
- Digital currencies are currencies that are only accessible with computers or mobile phones because they only exist in electronic form.
End-of-Chapter Exercises
- Unemployment Rate. Visit Statistics Canada and locate the most recent unemployment reports. Can you find annual employment rates by industry? Which industry has the most employment? Share your findings with the class and/or professor.
- Inflation Rate. Visit Statistics Canada and locate the most recent inflation reports. In which province is inflation rising the fastest? Is the government taking any action to combat rising inflation rates? Share your findings with the class and/or professor.
- Pros and Cons of Economies. Use the Internet to search the pros and cons of each of the different types of economies. Which economy makes the most sense to you? Why? Share your conclusions with the class and/or professor.
- Gross Domestic Product (GDP). Use the Internet to locate the most recent GDP reports. Which countries have the highest GDP Per Capita? What does the term “per capita” mean? Is there a correlation between lower GDP per capita in developing countries compared to developed nations? Share your findings with the class and/or professor.
- Surplus and Shortage. Use the Internet to locate an example in which a surplus of a product led to decreased prices. Similarly, locate an example in which a shortage of a product led to increased prices. What eventually happened in each case? Share your findings with the class and/or professor.
- Government Assistance. Use the Internet to locate an example in which the Government (Canadian or U.S.) provided funds in assistance to a business. Is the Government supporting businesses by providing funds consistent with a free market system? Explain how this might distort the system. Share your findings with the class and/or professor.
- Economic Indicators. Explain how current inflation and unemployment rates affect you personally. Explain how they may affect you as a manager. Share your thoughts with the class and/or professor.
- Government Roles. The government plays a variety of roles in the Canadian mixed economy. Use the Internet to locate an example of when the government has been a customer, a regulator, a taxation agent, and a provider of services. Discuss with the class and/or professor whether government involvement in each role is excessive, or about right. What criteria did you use to make your assessments?
- Getting Acquainted with Canadian Banks. Visit the website of a bank that is near to where you are located. Locate the current interest rates on investments as well as on loans. What are the latest bank policies shared on the website? What other kinds of information does the website provide? Share your findings with the class and/or professor.
- Competitive Analysis. Use Porter’s Five Forces analysis to analyze the competitive positions of any one of the following companies: Toyota, Walmart, First Choice Hair Cutters, Canadian Tire, or Cara Foods. Describe the five forces and how they affect the company’s operations and strategies. Share your findings with the class and/or professor.
- Monetary Policy Simulation: You’re in Control. How would it feel to be in control of the monetary policy of a country? Play MoPoS, the Monetary Policy Simulation Game at. Download the game, then play. You will act out the role of a fictitious central bank by implementing monetary policy in a simple virtual economy, all the while observing the limitations of monetary policy. Write a summary of your experience. What did you learn from playing the simulation? Share your summary with your class and/or professor.
- Supply and Demand Simulation. Visit the Lemonade Stand Free Trial game. Using information you learned in this chapter, write a brief summary about your experience as an entrepreneur dealing with economic factors of supply and demand and environmental conditions that may impact your business. Consider how much revenue you made each time you played the game and the reasons for your business success or failure. Share your summary with your class and/or professor.
- Fiscal Policy Game. This game, The Fiscal Ship, allows you to practice your decision-making as it pertains to fiscal policy based on the U.S. economy. Give it try by visiting the Federal Reserve Bank of St. Louis website. What did you learn? Was it difficult to make the right decisions to help put the Fiscal Ship on the right course? Share your thoughts about the game with your class and/or professor.
Self-Check Exercise: Economics and Banking Quiz
Check your understanding of this chapter’s concepts by completing this short self-check quiz.
Additional Resources
- Markets, Efficiency, and Price Signals: Crash Course Economies. YouTube Video.
- The Free Market: Competition, Monopolies, and the Dynamics of Innovation. YouTube Video.
- What is a Monopoly? YouTube Video.
- Economy: What It Is, Types of Economies, Economic Indicators
- The Business Cycle: Aggregate demand and aggregate supply. Khan Academy.
- Factors of Production, AP Microeconomics, Khan Academy, YouTube Video.
- Labour Statistics: Statistics Canada
- Canadian National Debt Clock
- How Much Federal Debt is Too Much For Canada? CBC News 2023, YouTube Video.
- Bank of Canada, Understanding the Consumer Price Index
- Inflation calculator
- Gross Domestic Product (GDP) and Government Revenue Explained in One Minute. YouTube Video.
- Unemployment Rate and the Labor Force Participation Rate Compared in One Minute. YouTube Video.
- Difference Between Micro and Macro Economics. YouTube Video.
- Circular Flow Model: Definition and Calculation
- What is Productivity?
- Economic Games to Play!
- BANK! Apple App Game
- Financial Games and Fun Activities for the Classroom
- Imports, Exports, and Exchange Rates: Crash Course Economics #15
- Difference Between Micro and Macro Economics (with examples), YouTube Video.
Attributions
The contents of this chapter is a compilation sourced from various OER resources, please refer to the Book Information for details.
References
(Note: This reference list was produced using the auto-footnote and media citation features of Pressbooks)
Media Attributions
- Circular Flow of Inputs and Outputs © Unknown is licensed under a CC BY-NC-SA (Attribution NonCommercial ShareAlike) license
- game © Bank of Canada Museum is licensed under a All Rights Reserved license
- Economic Systems © Wikimedia Commons | Designed for Virginia Tech by B. Craig licensed CC BY
- The Demand Curve © Unknown is licensed under a CC BY-NC-SA (Attribution NonCommercial ShareAlike) license
- The Supply Curve © Unknown is licensed under a CC BY-NC-SA (Attribution NonCommercial ShareAlike) license
- The Equilibrium Price © Unknown is licensed under a CC BY-NC-SA (Attribution NonCommercial ShareAlike) license
- The Business Cycle © Unknown is licensed under a CC BY-NC-SA (Attribution NonCommercial ShareAlike) license
- Statistics Canada Employment Rate © Statistics Canada is licensed under a All Rights Reserved license
- Unemployment Rate Map © Statistics Canada is licensed under a All Rights Reserved license
- Consumer Price Index Chart © Statistics Canada is licensed under a All Rights Reserved license
- pexels-pavel-danilyuk-7654610 © Pavel Danilyuk | Pexels
- Bank of Canada Monetary Policy © Unknown is licensed under a CC BY-NC-SA (Attribution NonCommercial ShareAlike) license
- Money Cat © Allange | Pixabay
- Bitcoin Decentralized Cryptocurrency © Benjamin Nelan | Pixabay
- Study.com. (n.d.). How do you explain the circular flow model? https://study.com/academy/lesson/circular-flow-diagram-in-economics-definition-example.html#:~:text=The%20circular%20flow%20model%20is,wages%20and%20providing%20goods%2Fservices. ↵
- McKinsey & Company. (2024, May 17). What is productivity? https://www.mckinsey.com/featured-insights/mckinsey-explainers/what-is-productivity ↵
- McKinsey & Company. (2024, May 17). What is productivity? https://www.mckinsey.com/featured-insights/mckinsey-explainers/what-is-productivity ↵
- University of Windsor & Ryerson University. (2022). Indigenous lifeways in Canadian business. https://ecampusontario.pressbooks.pub/indigenousbusinesstopics/chapter/chapter-1/ ↵
- Brown, S. (2021, November 10). What happens when a patent expires? https://patentexperts.org/patent/faqs/patent-expiration/ ↵
- University of Minnesota. (2016). Exploring Business. https://open.lib.umn.edu/exploringbusiness/chapter/1-5-monopolistic-competition-oligopoly-and-monopoly-2/ ↵
- Reserve Bank of Australia. (n.d.) Causes of inflation. https://www.rba.gov.au/education/resources/explainers/causes-of-inflation.html#:~:text=More%20jobs%20and%20higher%20wages,to%20an%20increase%20in%20inflation. ↵
- International Monetary Fund. (n.d.). Inflation: Prices on the rise. https://www.imf.org/en/Publications/fandd/issues/Series/Back-to-Basics/Inflation#:~:text=What%20creates%20inflation%3F,power%20falls%20and%20prices20rise. ↵
- Royal Bank of Canada. (n.d.). About us. https://www.bankofcanada.ca/about/#:~:text=Currency%3A%20We%20design%2C%20issue%20and,programs%20and%20foreign%20exchange%20reserves. ↵
- Fraser Research Bulletin. (2024). The growing debt burden of Canadians: 2024 edition. https://www.fraserinstitute.org/sites/default/files/growing-debt-burden-for-canadians-2024.pdf ↵
- Fraser Research Bulletin. (2024). The growing debt burden of Canadians: 2024 edition. https://www.fraserinstitute.org/sites/default/files/growing-debt-burden-for-canadians-2024.pdf ↵
- Fraser Research Bulletin. (2024). The growing debt burden of Canadians: 2024 edition. https://www.fraserinstitute.org/sites/default/files/growing-debt-burden-for-canadians-2024.pdf ↵
- Government of Canada. (2024). Debt management strategy. https://budget.canada.ca/2024/report-rapport/anx2-en.html ↵
- Bank of Canada. (2023). Selected monetary aggregates and their components. https://www.bankofcanada.ca/rates/banking-and-financial-statistics/selected-monetary-aggregates-and-their-components-formerly-e1/ ↵
- International Monetary Fund. (n.d.). What is the IMF? https://www.imf.org/en/About/Factsheets/IMF-at-a-Glance#:~:text=The%20International%20Monetary%20Fund%20(IMF,%2C%20and%20economic%20well%2Dbeing. ↵
- Bank of Canada. (n.d.). About Us. https://www.bankofcanada.ca/about/ ↵
- Xe. (n.d.). US Dollar to Canadian Dollar Exchange Rate Chart. https://www.xe.com/currencycharts/?from=USD&to=CAD ↵
- Bank of Canada. (n.d.) The road to digital money. https://www.bankofcanada.ca/2019/04/the-road-to-digital-money/ ↵
Economics is the study of how individuals, businesses, governments and nations allocate their limited resources to satisfy their unlimited wants and needs.
Scarcity is one of the key concepts of economics. It means that the demand for a good or service is greater than the availability of the good or service.
Microeconomics is the study of individuals and business decisions.
Macroeconomics looks at the decisions of countries and governments.
Inputs are the elements which goes into producing a good or service such as labor, raw materials, capital, land, entrepreneurship etc.
Output is the finished product coming from a production process.
Productivity refers to how efficiently goods and services are being produced.
A free market economy is an economic system where the laws of supply and demand determine prices, and the government has limited or no involvement
A mixed economy is an economic system where some resources are planned for by the government, while citizens control others. The world's dominant economic organization is a mixed economy.
Planned economy is a system where the state determines production levels and regulates prices. In a centrally planned economy, the state uses advanced planning mechanisms to determine production levels, rather than supply and demand.
Capitalism is an economic system that promotes the creation and ownership of capital and wealth.
Socialism is an economic and political system where the means of production are owned by the public or the state, rather than private individuals. It's based on the idea that shared ownership of resources leads to a more equal society.
Communalism is a political and economic system that aims to eliminate class struggles by having the public own the means of production, such as factories and mines. In a communist society, there is no private property or currency, and wealth is shared equally or based on need. Communism is not the same as a planned economy, but communism is often associated with centrally planned economies.
Planned system is an economic system in which the elements of an economy (such as labor, capital, and natural resources) are subject to government control and regulation designed to achieve the objectives of a comprehensive plan of economic development.
Free market system is defined as an economy operating by free competition.
A mixed market economy is defined as an economic system blending elements of a market economy with elements of a planned economy, markets with state interventionism, or private enterprise with public enterprise.
Perfect competition exists when there are many consumers buying a standardized product from numerous small businesses. Because no seller is big enough or influential enough to affect price, sellers and buyers accept the going price.
Monopolistic competition occurs when an industry has many firms offering products that are similar but not identical. Unlike a monopoly, these firms have little power to curtail supply or raise prices to increase profits.
Oligopoly means few sellers. In such an oligopolistic market, each seller supplies a large portion of all the products sold in the marketplace.
A monopoly is a market structure characterized by a single seller, selling a unique product in the market. In a monopoly market, the seller faces no competition, as he is the sole seller of goods with no close substitute.
Supply is the quantity of a product that sellers are willing to sell at various prices.
Demand is the quantity of a product that buyers are willing to purchase at various prices.
The law of supply and demand is an economic theory that explains how the relationship between supply and demand determines prices. When supply is greater than demand, prices fall, and when demand is greater than supply, prices rise.
The Equilibrium Price is the price point at which the demand and supply curves intersect.
Gross domestic product (GDP) is defined as the market value of all goods and services produced by the economy in a given year.
Gross national product is the value of all products and services produced by citizens of a country both domestically and internationally minus income earned by foreign residents.
The business cycle is the regular economic pattern of upturns and downturns in demand and output within the economy that tend to repeat themselves every three to five years or may last much longer.
Statistics Canada tracks unemployment and reports the unemployment rate: the percentage of the labour force who are at least 15 years old that is unemployed and actively seeking work.
Price stability is the stable level of prices in the economy, which avoids long periods of inflation or deflation and sustains the value of money over time.
Inflation is a sustained rise in the average prices of goods within an economy. It can also be explained as the fall in the purchasing power of money, since it is usual for wages to move ahead at least as fast as the price level.
Deflation is downward pressure upon the level of economic activity. It is a period of falling demand and prices. It is usually accompanied by reduce output and rising unemployment.
The CPI measures the rate of inflation by determining price changes of a hypothetical basket of goods, such as food, housing, clothing, medical care, appliances, automobiles, and so forth, bought by a typical household.
The producer price index (PPI) tracks the average change in prices at the wholesale level (e.g., raw materials, product components that require further processing, and finished goods sold to retailers).
An economic indicators are the monthly statistics that provide information on the country's economic performance. There are different types of indicators which are all subject to considerable error, so it is unwise to draw any conclusions from just one month's data.
Leading indicators give a prediction of future events.
Coincident indicators show the state of the economy today.
Lagging indicators show the health of the economy in the recent past.
Monetary policy is concerned with the money supply, rates of interest, exchange rates and the amount of credit available in order to control the level of spending within the economy.
The Bank of Canada is a special type of Crown corporation that is owned by the federal government, but has considerable independence to carry out its responsibilities and therefore operates separately from the political process.
Fiscal policy is a government towards its raising of revenue and its level of public spending.
National debt is the liabilities of the government sector. Historically, government deficits have occurred much more often than surpluses since government typically spends more than it takes in.
Money is anything that is acceptable as payment for goods and services. It affects our lives in many ways.
M-1 is the narrowest measure, and it includes the most liquid forms of money — the forms, such as cash and chequing account funds, that are spent immediately.
M-2 includes everything in M-1 plus near-cash items invested for the short term — savings accounts, time deposits and money market mutual funds.
The World Bank is an important source of economic assistance for poor and developing countries.
The International Monetary Fund (IMF) is governed by and accountable to its 191 member countries and has three critical missions: furthering international monetary cooperation, encouraging the expansion of trade and economic growth, and discouraging policies that would harm prosperity. The IMF loans money to countries with troubled economies.
Currencies are traded in the foreign exchange market. Like any other market, when something is exchanged there is a price. In the foreign exchange market, a currency is being bought and sold, and the price of that currency is given in some other currency. That price is expressed as an exchange rate.
Digital currencies are currencies that are only accessible with computers or mobile phones because they only exist in electronic form.
