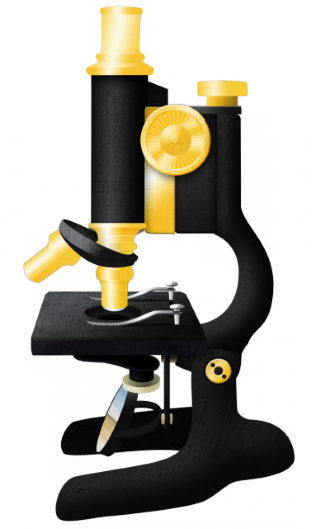
Experiment #1: The light microscope
Tutorial 2: Using ImageJ to set image scale
 ImageJ is a very powerful image analysis software that was developed by the National Institutes of Health. is widely used by scientists, in particular biologists and astronomers. It is open source and free and run across platforms. Users can add modalities to the main program by writing instructions in either macros or plugins. In this class, we will simply learn how to use ImageJ, without worrying about writing codes.
You can download ImageJ and access a number of resources by visiting https://imagej.net/Welcome.
ImageJ (very) basics.

When you open ImageJ, an elongated window appears on your screen, that contains a toolbar (a row of icons allowing you to access a number of basic tools) and a status bar (in the example above the status bar shows the position and intensity value of the pixel on which the mouse is placed).
To get started, open any image on your computer using File > Open in the menu bar. At the top of the image, you can see the image pixel dimensions, its type (usually 8-bit or 16-bit greyscale – that is a black and white image with either 28 = 256 or 216 levels of grey, or RGB – that is a color image with separate levels of red, green and blue).
Some interesting tools:
![]() Area selection tools: Allow select an area in the image, that can then be cropped, copied or measured using commands in the menu bar (for example Analyze > Measure will give you the area of the selection, as well as the average, minimum and maximum pixel intensity within the selection).
Area selection tools: Allow select an area in the image, that can then be cropped, copied or measured using commands in the menu bar (for example Analyze > Measure will give you the area of the selection, as well as the average, minimum and maximum pixel intensity within the selection).
 Line selection tool: Allows to create different types of lines for measurements or drawing purposes. The length of the line is displayed in the status bar as you draw it. Choosing Analyse > Measure from the menu bar allows you to record its length. Choosing Edit > Draw allows you to draw the line on your image.
 Multi-point tool: Allows you to select points in the image for annotation or measurement. Choosing Analyse > Measure from the menu bar returns a list of all selected points, with their coordinates and pixel intensity value.
Below is a detailed description of the steps you can follow to set the scale of an image with ImageJ, and a series of questions you should go through in order to make sure you understand this procedure in depth. You do not need to submit your answers to these questions, nor do you need to include these answers in your lab report. However, going through them should help you analyze the images you collected during the lab.
Open the image called “CalibrationSlide_10x.tif”, which shows you the image of a slide used for calibration purpose imaged with an objective with 10x magnification.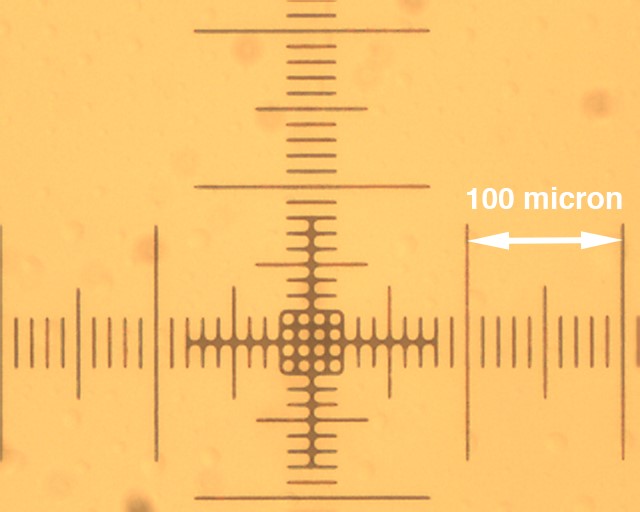
- To make quantification easier, change the type of the image from RGB to 8-bit grayscale using Image > Type > 8-bit. Your image should turn gray.
- A digital image is an array of points called pixels (short for Picture Elements), which are square areas holding a single intensity value. Zoom in on a region of the image using the “Magnifying glass” tool found in the toolbar until you can see individual pixels. Then zoom out again to see the whole image. ๏ Select the “Line” tool and draw a line between two of the vertical marks in the image. The further apart the two lines you chose, the more precise the calibration will be.
- Select Analyze > Set scale. The first field in the “Set Scale” windows that appears (called “Distance in pixels”) is the length of your line in pixel.
- Type the actual known distance between the two marks you have selected, and the appropriate unit of length (micron). The scale of your image (in pixels/micron) is displayed at the bottom of the window.
- Press ok. Notice how the size of your image is now displayed in microns. All the measurements you make on this image will now be displayed in microns.
- Add an actual scale bar to your image with Analyze > Tools > Scale Bar.
- You can now set the scale of any image recorded on the same microscope with the same objective, by directly entering it in the “Set Scale” window.
- Open the images “CalibrationSlide_20x.tif” and “CalibrationSlide_40x.tif” which show the exact same calibration slide, but imaged with objectives with 20x and 40x magnification, respectively.
- Repeat the calibration procedure for these two new images.
- We are now going to use ImageJ to measure contrast, defined here as:

With the line tool, draw a line through some of the features in the image. Use Analyze > Plot Profile to generate a plot of the intensity values in the image along this line. Note that dark areas correspond to low intensity values, while lighter areas correspond to high intensity values.