9.4 Human Population Growth
Historical Patterns and Future Projections
Human population growth has changed dramatically over time. For most of history, populations grew slowly due to high death rates from disease, famine, and limited medical knowledge. The Agricultural Revolution (~10,000 years ago) allowed for more stable food supplies, leading to gradual growth. The Industrial Revolution in the 18th and 19th centuries brought advances in medicine, sanitation, and food production, causing death rates to fall and triggering exponential growth. The global population now exceeds 8 billion.
However, growth is slowing. The global population growth rate peaked in 1963 at about 2.3% per year. Since then, it has steadily declined due to falling fertility rates worldwide. The annual growth rate is now below 1%, the slowest rate since 1950 (United Nations, 2024). This decline is largely driven by women having fewer children and by increasing access to education, healthcare, and family planning. UN projections estimate that the global population will peak at around 10.3 billion in the mid-2080s. This peak is 700 million lower than projections made a decade ago, largely due to declining fertility rates. Over half of all countries now have fertility rates below the replacement level of 2.1 children per woman.
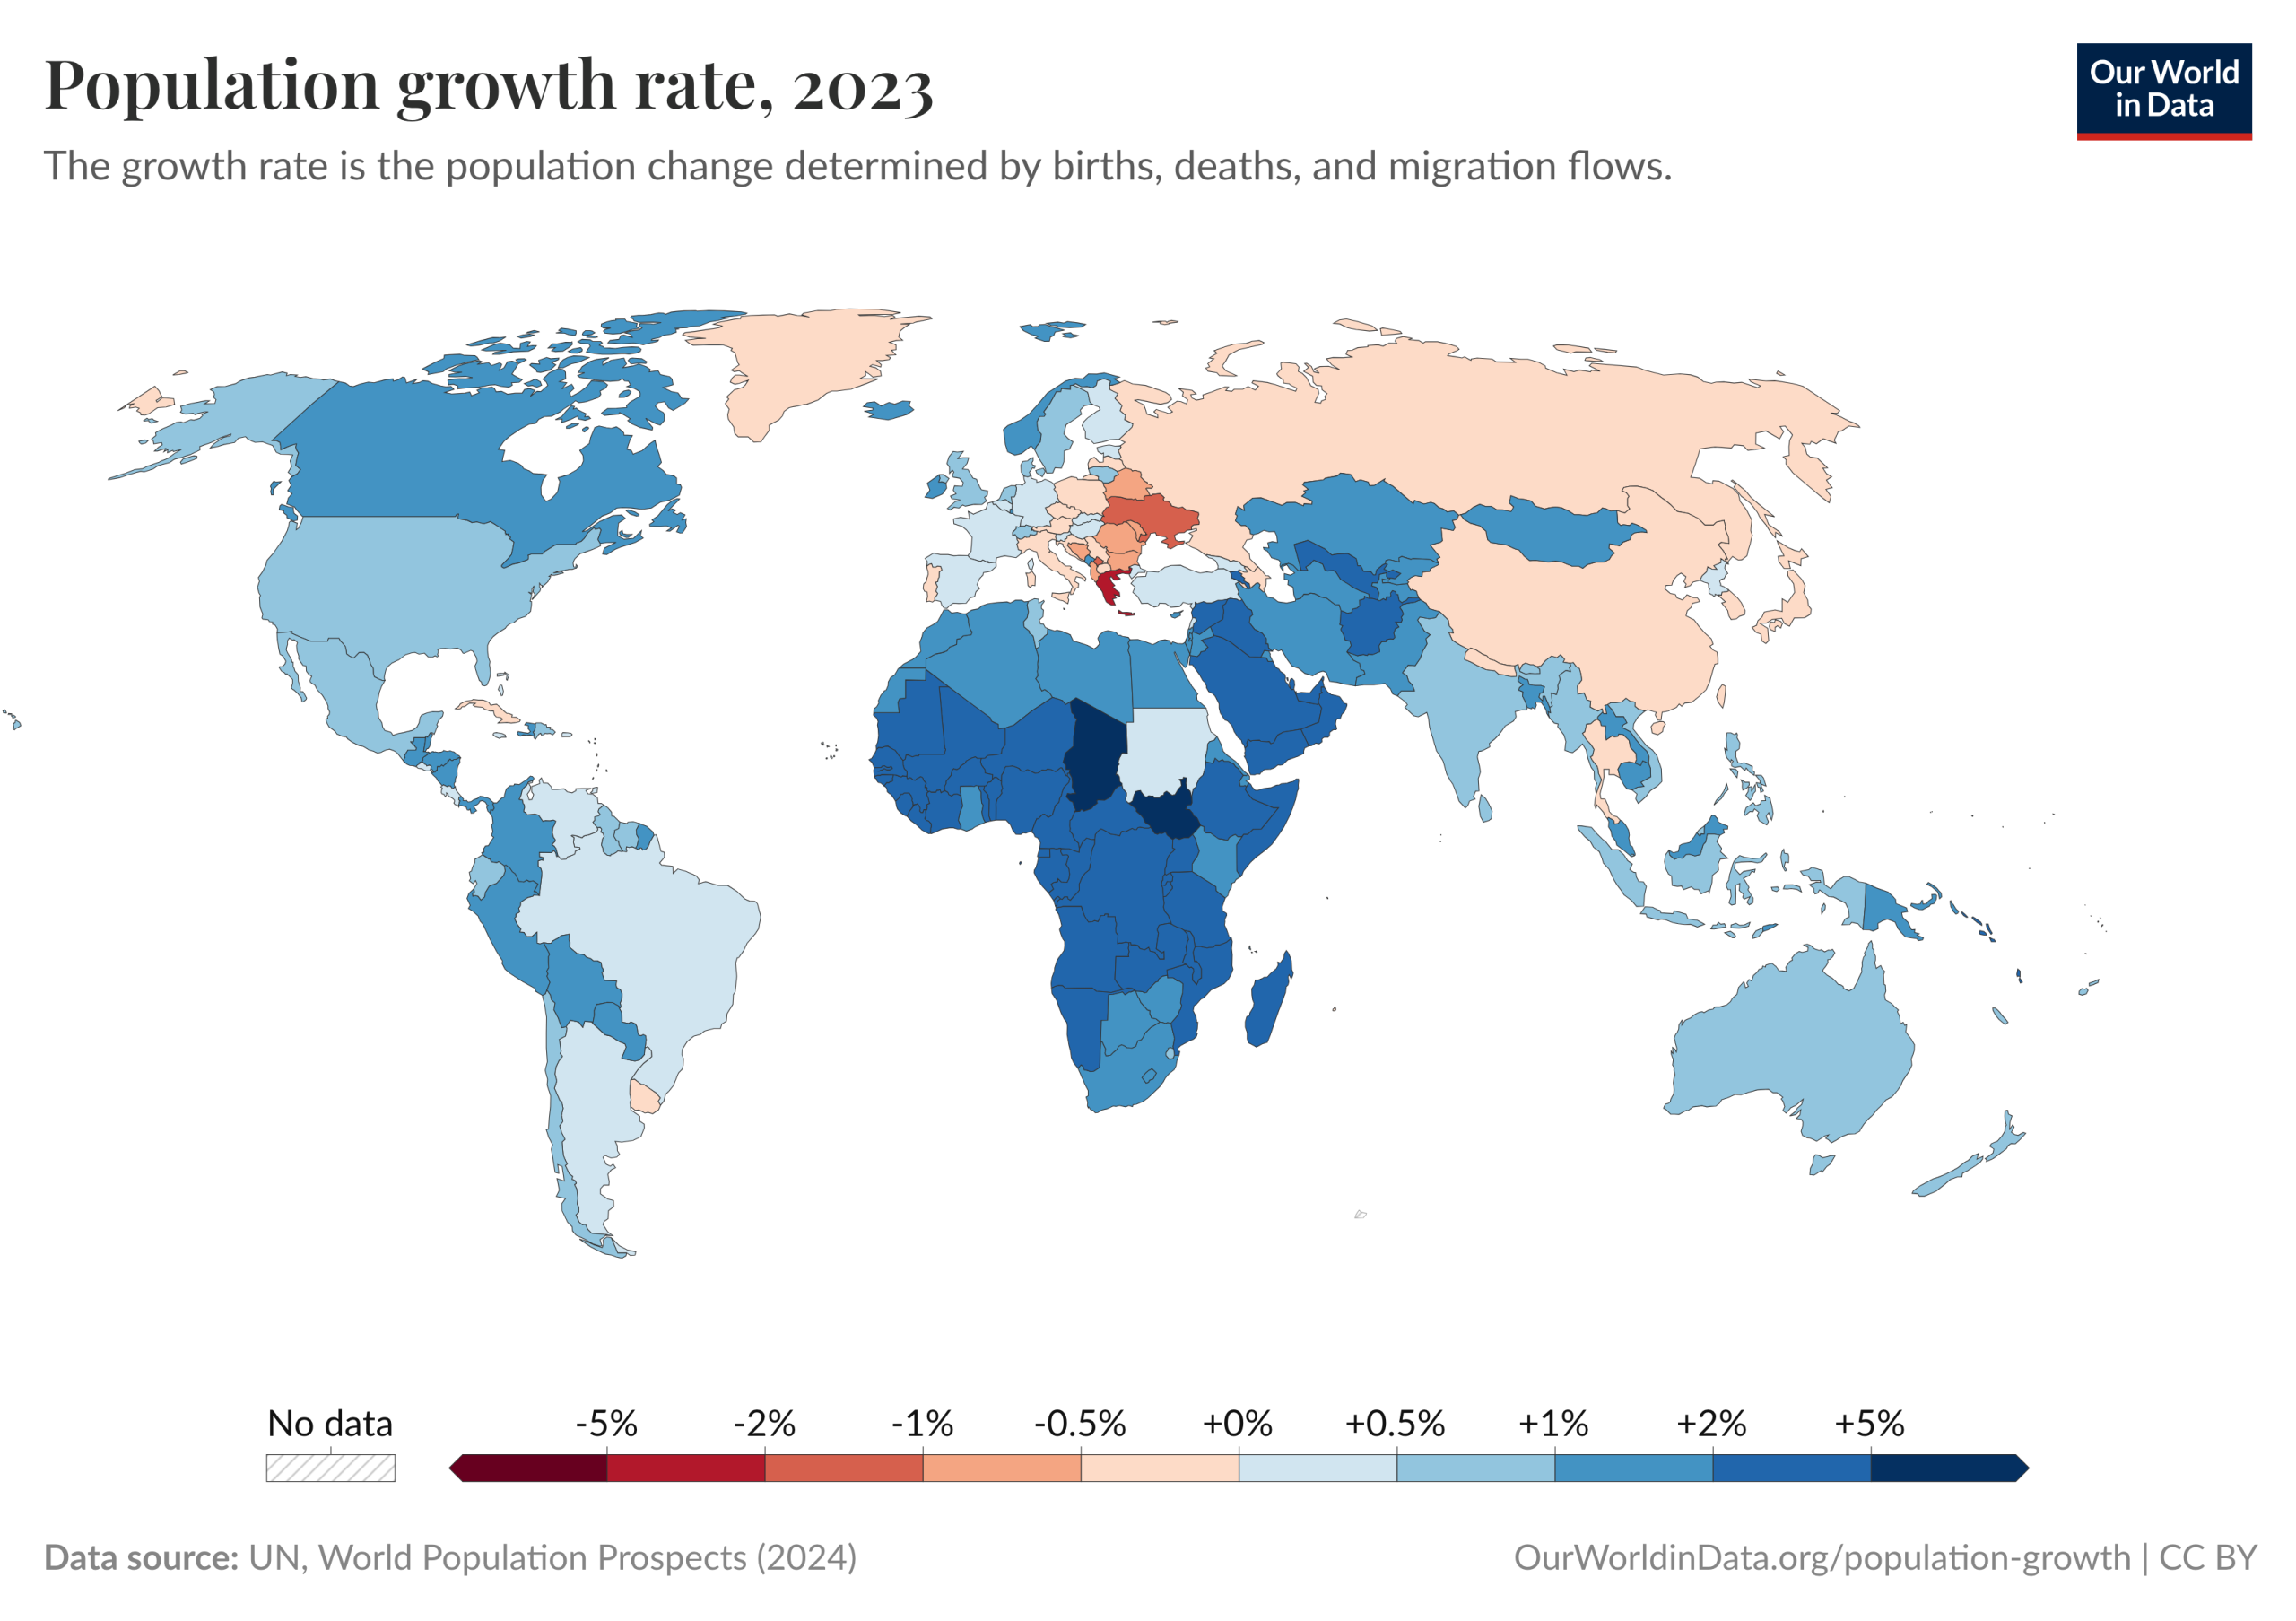
Figure 9.4.1 Image Description
A world map titled “Population growth rate, 2023” showing the annual percentage change in population across countries, determined by births, deaths, and migration. Countries are shaded from dark red (population decline of –5% or more) to dark blue (population growth of +5% or more).
- High growth (dark blue): Concentrated in sub-Saharan Africa, including countries like Niger, Chad, and the Democratic Republic of the Congo.
- Moderate growth (light to medium blue): Found in most of Africa, South Asia, and parts of the Middle East.
- Low or near zero growth (light beige to pale blue): Includes much of North America, South America, and Oceania.
- Population decline (red to orange): Observed in Eastern Europe, Russia, parts of Central Europe, and East Asia (including Japan).
- No data: Marked with gray diagonal stripes for a few small countries or territories.
Age Structure and Economic Development
Age structure is the distribution of individuals across age groups. Age structure diagrams visually represent the number of individuals in different age groups, typically separated by sex. These diagrams help illustrate whether a population is growing, stable, or declining. A wide base indicates a high proportion of young people and potential for rapid growth, while a narrow base and wider top suggest an aging population and potential population decline.
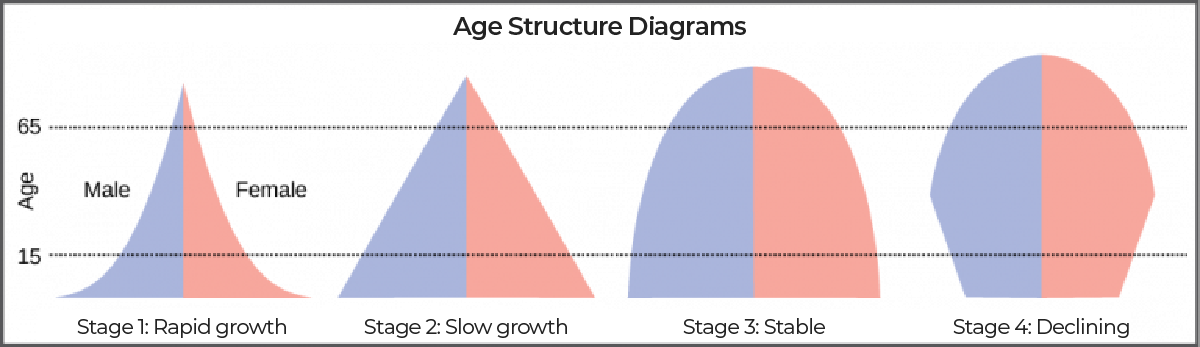
Figure 9.4.2 Image Description
A set of four population age structure diagrams comparing males (blue) and females (red) across different growth stages. Dashed horizontal lines mark ages 15 and 65, showing the proportion of youth and elderly in each stage.
- Stage 1: Rapid growth – Pyramid shape with a wide base and narrow top, indicating many young people and few older individuals.
- Stage 2: Slow growth – Triangle shape with a broader base but less steep sides, showing a slower population increase.
- Stage 3: Stable – Bell shape with a more even distribution across ages, indicating little overall growth.
- Stage 4: Declining – Barrel shape with a narrower base than the middle, showing fewer young people and an aging population.
Age structure has major implications for economic development and social planning. Countries with a young population face challenges in providing education, jobs, and healthcare for a growing youth population. In contrast, countries with an aging population must support a shrinking workforce and increasing healthcare needs for the elderly.
Carrying Capacity of Humans
Calculating the carrying capacity for humans is particularly complex because it depends not only on population size, but also on consumption patterns, technology, and lifestyle choices.
One way to measure our impact is through the ecological footprint, which calculates how much biologically productive land and water area a population requires to produce the resources it consumes and absorb its waste. This is compared to biocapacity, the Earth’s ability to regenerate those resources and absorb waste, especially carbon emissions.
According to the Global Footprint Network (n. d.), the global ecological footprint is about 2.5 global hectares (gha) per person. The Earth’s biocapacity is only about 1.6 gha per person. This means that humanity is using resources at a rate that would require 1.7 Earths to sustain long-term. This condition is known as ecological overshoot – when demand exceeds nature’s ability to regenerate. Overshoot leads to deforestation, soil erosion, biodiversity loss, and climate change.
The gap between ecological footprint and biocapacity is not evenly distributed. High-income countries tend to have much larger footprints per person, while low-income countries often live within or below their biocapacity. For Canada, the average ecological footprint per person is 8.7 gha. If everybody on Earth lived like Canadians, we would need over 5 Earths to stay within biocapacity.
This highlights the importance of addressing not just population size, but also inequities in consumption and resource use. To live within Earth’s carrying capacity, we must:
- Reduce overconsumption and waste
- Transition to renewable energy
- Protect and restore ecosystems
- Shift toward sustainable food systems and urban planning
Ultimately, the planet’s ability to support human life depends not just on how many people there are, but on how sustainably we live.
Knowledge Check
Text Description
- The Industrial Revolution
- The Medical Revolution
- The Agricultural Revolution
- The Digital Revolution
- An increase in global conflict
- Higher infant mortality rates
- Falling fertility rates and greater access to education and healthcare
- Decrease in agricultural productivity
- A declining population with high life expectancy
- A stable population with balanced age groups
- A growing population with many young people
- An aging population with low birth rates
- There is too much unused land on the planet
- Resource use is equal to the Earth’s ability to regenerate
- Human demand exceeds Earth’s capacity to regenerate resources
- The global population is below replacement level
- It changes weekly due to weather patterns
- It depends on age structure alone
- It is based solely on population density
- It includes variables like consumption, technology, and lifestyle
Answers:
- c
- c
- c
- c
- d
OpenAI. (2025). ChatGPT. [Large language model]. https://chat.openai.com/chat
Prompt: Create 5 multiple-choice questions using the following content
“16.3 The Human Population” from Biology and the Citizen by Colleen Jones is licensed under a Creative Commons Attribution 4.0 International License, except where otherwise noted.
