9.1 Overview of Population Ecology
A population is a group of individuals of the same species living in the same area at the same time. Population ecology focuses on how these groups change over time – how many individuals are born, how many die, and how they interact with their environment. Scientists study population size, density, distribution, and growth to understand how species survive and adapt.
Population Size and Density
Two basic ways to describe a population are by its size and density.
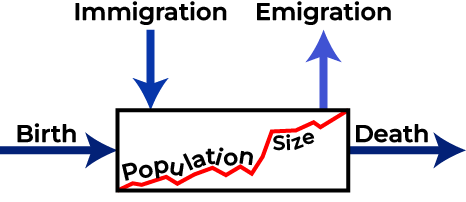
Population size refers to the total number of individuals in a population at a specific time. For example, if there are 500 deer in a forest, the population size is 500. This number is always changing due to births, deaths, immigration, and emigration. Births and immigration increase the population, while deaths and emigration decrease it. For example, the population will grow if more individuals are born or move into an area than die or leave. These changes can happen gradually or rapidly, depending on environmental conditions, food availability, disease, natural disasters, or human activity. Understanding how and why population size changes helps scientists monitor species health, predict future trends, and make decisions about conservation and resource management.
The most accurate way to determine population size is to count all of the individuals within the area; however, this method is usually not logistically or economically feasible, especially when studying large areas. Thus, scientists usually study populations by sampling a representative portion of each habitat and use this sample to make inferences about the population as a whole.

One common method is quadrant sampling, where researchers mark off small, square plots in a habitat and count the number of individuals within each one. They then use these counts to estimate the total population in the larger area. This method works well for plants or slow-moving animals. For more mobile species, scientists often use the mark-recapture method. In this technique, a group of individuals is captured, marked in a harmless way, and released back into the environment. Later, another group is captured, and researchers count how many of them are marked. Using this data, they can estimate the total population using a simple formula. These sampling methods help ecologists make informed estimates without needing to observe every single organism.
Population density is the number of individuals per unit area or volume. If those 500 deer live in a 100-square-kilometre forest, the density is five deer per square kilometre.
Density tells us how crowded a population is. High-density populations may face more competition for limited resources like food, water, or nesting sites. They may also spread diseases more easily. In contrast, low-density populations might have trouble finding mates or may be more vulnerable to predators.
Species Distribution
Species distribution describes how individuals in a population are spaced out across their habitat. Even if two populations have the same size and density, the way individuals are spread out can be very different.
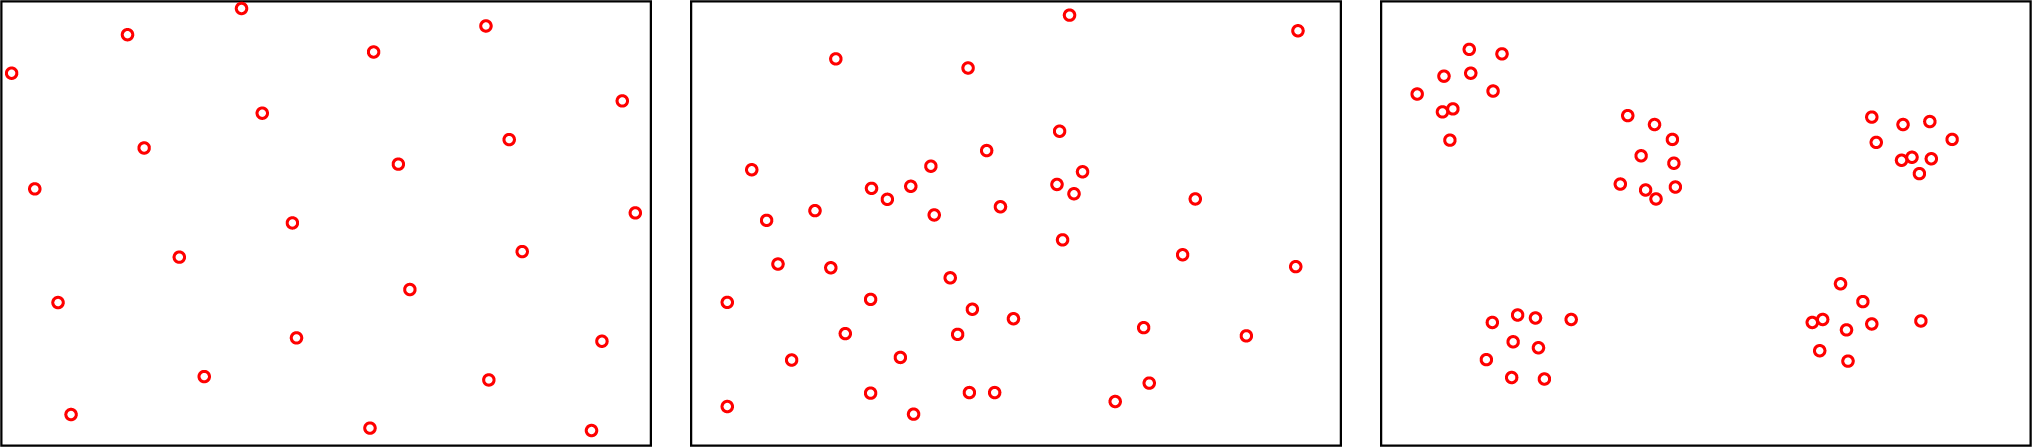
There are three main types of distribution:
- Uniform distribution: Individuals are spaced evenly. This can happen when there is competition for resources like sunlight or territory. For example, some desert plants grow at regular distances to avoid competing for water. It is also seen in territorial animal species, such as penguins, that maintain a defined territory for nesting.
- Random distribution: Individuals are spread unpredictably. This is rare in nature but can occur when resources are plentiful and evenly distributed. Dandelions growing in a field might show this pattern.
- Clumped distribution: Individuals group together in patches. This is the most common pattern in nature. Animals may clump around food sources, water, or shelter. For example, elephants often travel in herds, and mussels cluster on rocks in the ocean. It may also be seen in plants that drop their seeds straight to the ground, such as oak trees.
The distribution of the individuals within a population provides more information about how organisms interact with each other than does a simple density measurement. Just as lower-density species might have more difficulty finding a mate, solitary species with a random distribution might have a similar difficulty when compared to social species clumped together in groups.
Survivorship Curves
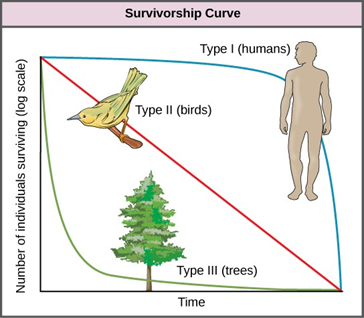
A survivorship curve is a graph that shows the number of individuals in a population that survive at each age. It helps ecologists understand patterns of survival and death over the lifespan of a species. There are three main types of survivorship curves, each representing a different life strategy:
- Type I – Most individuals survive to old age. Death usually occurs later in life. This pattern is common in large mammals like humans and elephants, which tend to have fewer offspring and invest heavily in their care.
- Type II – Individuals have an equal chance of dying at any age. This straight-line curve is seen in some birds, reptiles, and small mammals, where the risk of death is fairly constant throughout life.
- Type III – Most individuals die young, but those who survive early life tend to live much longer. This curve is typical of species like insects, fish, and many plants, which produce large numbers of offspring but provide little or no parental care.
Life History Strategies
Different species have different life history strategies for survival and reproduction. Ecologists describe these strategies using the terms r-selected and K-selected species. These terms come from variables used in population growth models: r represents the growth rate, and K represents the carrying capacity of the environment.
r-selected species focus on rapid growth and reproduction. They tend to:
- Produce many offspring at once
- Invest little or no care in each individual
- Mature quickly and have short lifespans
- Have a small body size
- Thrive in unpredictable or changing environments
Examples of r-selected species include insects, bacteria, and many types of plants. These species often experience boom-and-bust population cycles, where numbers rise quickly and then crash when resources run out.
K-selected species, on the other hand, grow more slowly and invest more in each offspring. They tend to:
- Produce fewer offspring
- Provide more parental care
- Mature slowly and live longer
- Are larger in body size
- Compete well in stable environments near the carrying capacity
Examples include elephants, whales, and humans.
While r- and K-selection represent two ends of a spectrum, many species fall somewhere in between. Understanding these strategies helps ecologists predict how populations respond to environmental changes and human impacts.
Knowledge Check
Text Description
- The total number of species in an ecosystem
- The number of individuals per unit area or volume
- The rate at which a population grows over time
- The maximum population an environment can support
- Random distribution
- Uniform distribution
- Clumped distribution
- Linear distribution
- Type I
- Type II
- Type III
- Type IV
- Rapid maturity and short lifespan
- High number of offspring
- High parental investment
- Small body size
- They experience more disease outbreaks
- They face more competition for resources
- They may have difficulty finding mates
- They are more likely to be r-selected species
Answers:
- b
- c
- c
- c
- c
“Population Ecology” from Introductory Biology: Ecology, Evolution, and Biodiversity by Erica Kosal is licensed under a Creative Commons Attribution-NonCommercial 4.0 International License, except where otherwise noted. Modifications: rephrased some content.

#/media/File:Population_distribution.svg#)