3.3 Organizing Life on Earth
Systematics is the scientific study of the diversity of organisms and their evolutionary relationships. It involves identifying, naming, classifying, and determining the evolutionary connections among species.
Systematics includes two main branches: taxonomy and phylogenetics.
Taxonomy
Taxonomy (which literally means “arrangement law”) is the science of naming and grouping species to construct an internationally shared classification system. The taxonomic classification system (also called the Linnaean system after its inventor, Carl Linnaeus, a Swedish naturalist) uses a hierarchical model. A hierarchical system has levels, and each group at one of the levels includes groups at the next lowest level, so that at the lowest level, each member belongs to a series of nested groups. For example, in the most inclusive grouping, scientists divide organisms into three domains: Bacteria, Archaea, and Eukarya. Within each domain is a second level called a kingdom. Each domain contains several kingdoms. Within kingdoms, the subsequent categories of increasing specificity are: phylum, class, order, family, genus, and species.
As an example, the classification levels for the domestic dog are shown in Figure 3.3.1. The group at each level is called a taxon (plural: taxa). In other words, for the dog, Carnivora is the taxon at the order level, Canidae is the taxon at the family level, and so forth. Organisms also have a common name that people typically use, such as a domestic dog or a wolf. Each taxon name is capitalized except for species, and the genus and species names are italicized. Scientists refer to an organism by its genus and species names together, commonly called a scientific name, or Latin name. This two-name system is called binomial nomenclature. The scientific name of the wolf is therefore Canis lupus. A recent study of the DNA of domestic dogs and wolves suggests that the domestic dog is a subspecies of the wolf, not its own species. Thus, it is given an extra name to indicate its subspecies status, Canis lupus familiaris.
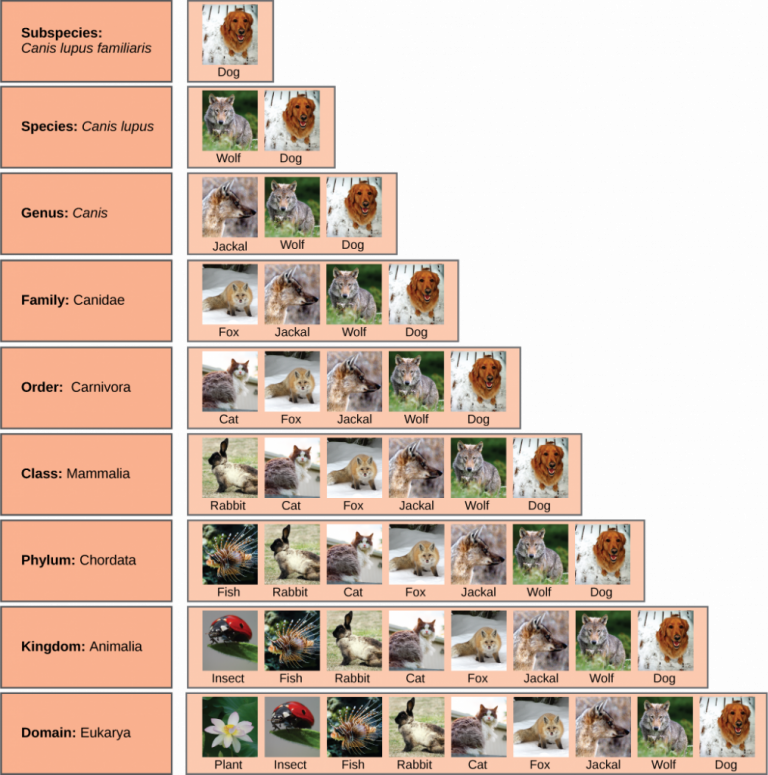
Figure 3.3.1 Image Description
The diagram shows the taxonomic classification of the domestic dog (Canis lupus familiaris), illustrated with images of different animals at each level. The hierarchy expands step by step from subspecies to domain:
- Subspecies: Canis lupus familiaris – Dog
- Species: Canis lupus – Wolf, Dog
- Genus: Canis – Jackal, Wolf, Dog
- Family: Canidae – Fox, Jackal, Wolf, Dog
- Order: Carnivora – Cat, Fox, Jackal, Wolf, Dog
- Class: Mammalia – Rabbit, Cat, Fox, Jackal, Wolf, Dog
- Phylum: Chordata – Fish, Rabbit, Cat, Fox, Jackal, Wolf, Dog
- Kingdom: Animalia – Insect, Fish, Rabbit, Cat, Fox, Jackal, Wolf, Dog
- Domain: Eukarya – Plant, Insect, Fish, Rabbit, Cat, Fox, Jackal, Wolf, Dog
Figure 3.3.1 also shows how taxonomic levels move toward specificity. Notice how, within the domain, we find the dog grouped with the widest diversity of organisms. These include plants and other organisms not pictured, such as fungi and protists. At each sublevel, the organisms become more similar because they are more closely related. Before Darwin’s theory of evolution was developed, naturalists sometimes classified organisms using arbitrary similarities, but since the theory of evolution was proposed in the 19th century, biologists have worked to make the classification system reflect evolutionary relationships. This means that all of the members of a taxon should have a common ancestor and be more closely related to each other than to members of other taxa.
Knowledge Check
Text Description
- Order: Carnivora
- Kingdom: Animalia
- Species: Canis lupus
- Genus: Canis
- Subspecies: Canis Lupus familiaris
- Phylum: Chordata
- Class: Mammalia
- Domain: Eukarya
- Family: Canidae
Anwers:
- Order: Carnivora
- Kingdom: Animalia
- Phylum: Chordata
- Class: Mammalia
- Domain: Eukarya
Phylogenetics
Recent genetic analyses have revealed that some traditional taxonomic classifications do not accurately reflect evolutionary relationships. As a result, classifications are continually revised as new discoveries are made. A notable example of this is the reclassification of prokaryotes. Until the 1970s, all prokaryotic organisms were grouped under Bacteria. However, molecular studies uncovered significant genetic differences, leading to the division of prokaryotes into two distinct domains: Bacteria and Archaea, now recognized as two of the three fundamental branches of life.
Understanding these evolutionary relationships is the focus of phylogenetics—the study of the evolutionary history and connections among organisms. Scientists use phylogenetic trees to visually represent these relationships. A phylogenetic tree is a branching diagram that reflects how species or groups of organisms have evolved from common ancestors. As species evolve and diverge over time, they form distinct lineages, which are depicted as branches on the tree.
By analyzing inherited traits and other historical evidence, biologists can reconstruct evolutionary pathways. These trees allow us to trace the lineage of a species back to its common ancestors and identify how closely related different organisms are. The branching patterns illustrate how evolution has shaped the diversity of life through descent with modification.
A Phylogenetic Tree for Vertebrates
Text Description
The image is a phylogenetic tree (cladogram) showing evolutionary relationships among different groups of vertebrates. From left to right, the diagram depicts sharks, ray-finned fish, amphibians, primates, rodents & rabbits, crocodiles, and dinosaurs & birds. Each branching point represents the evolution of a new trait.
Pop-up text on hotspots:
- Notice that the species are at the ends of the branches.
- The evolutionary relationships among these species is identified by the nodes (i.e., the branching points).
- Each node can be considered the common ancestor of the species that descend from that node. Notice that there are no images at the nodes. A limitation of phylogenetic trees is that these models do not indicate what the ancestor looked like- just that there is a common ancestor.
- The base of the tree is the common ancestor of all of the above species.
- Characteristics are listed with hashmarks along the tree. This indicates when the characteristic first evolved. In this case, primates, rabbits, rodents, crocodiles, dinosaurs, and birds all have amniotic eggs.
All life on Earth evolved from a common ancestor, so the phylogenetic tree starts with a single point and then branches into the three domains of Archaea, Bacteria, and Eukarya. Each domain then diverges and branches repeatedly. The small branch that plants and animals (including humans) occupy in this diagram shows how recently these groups had their origin compared with other groups.
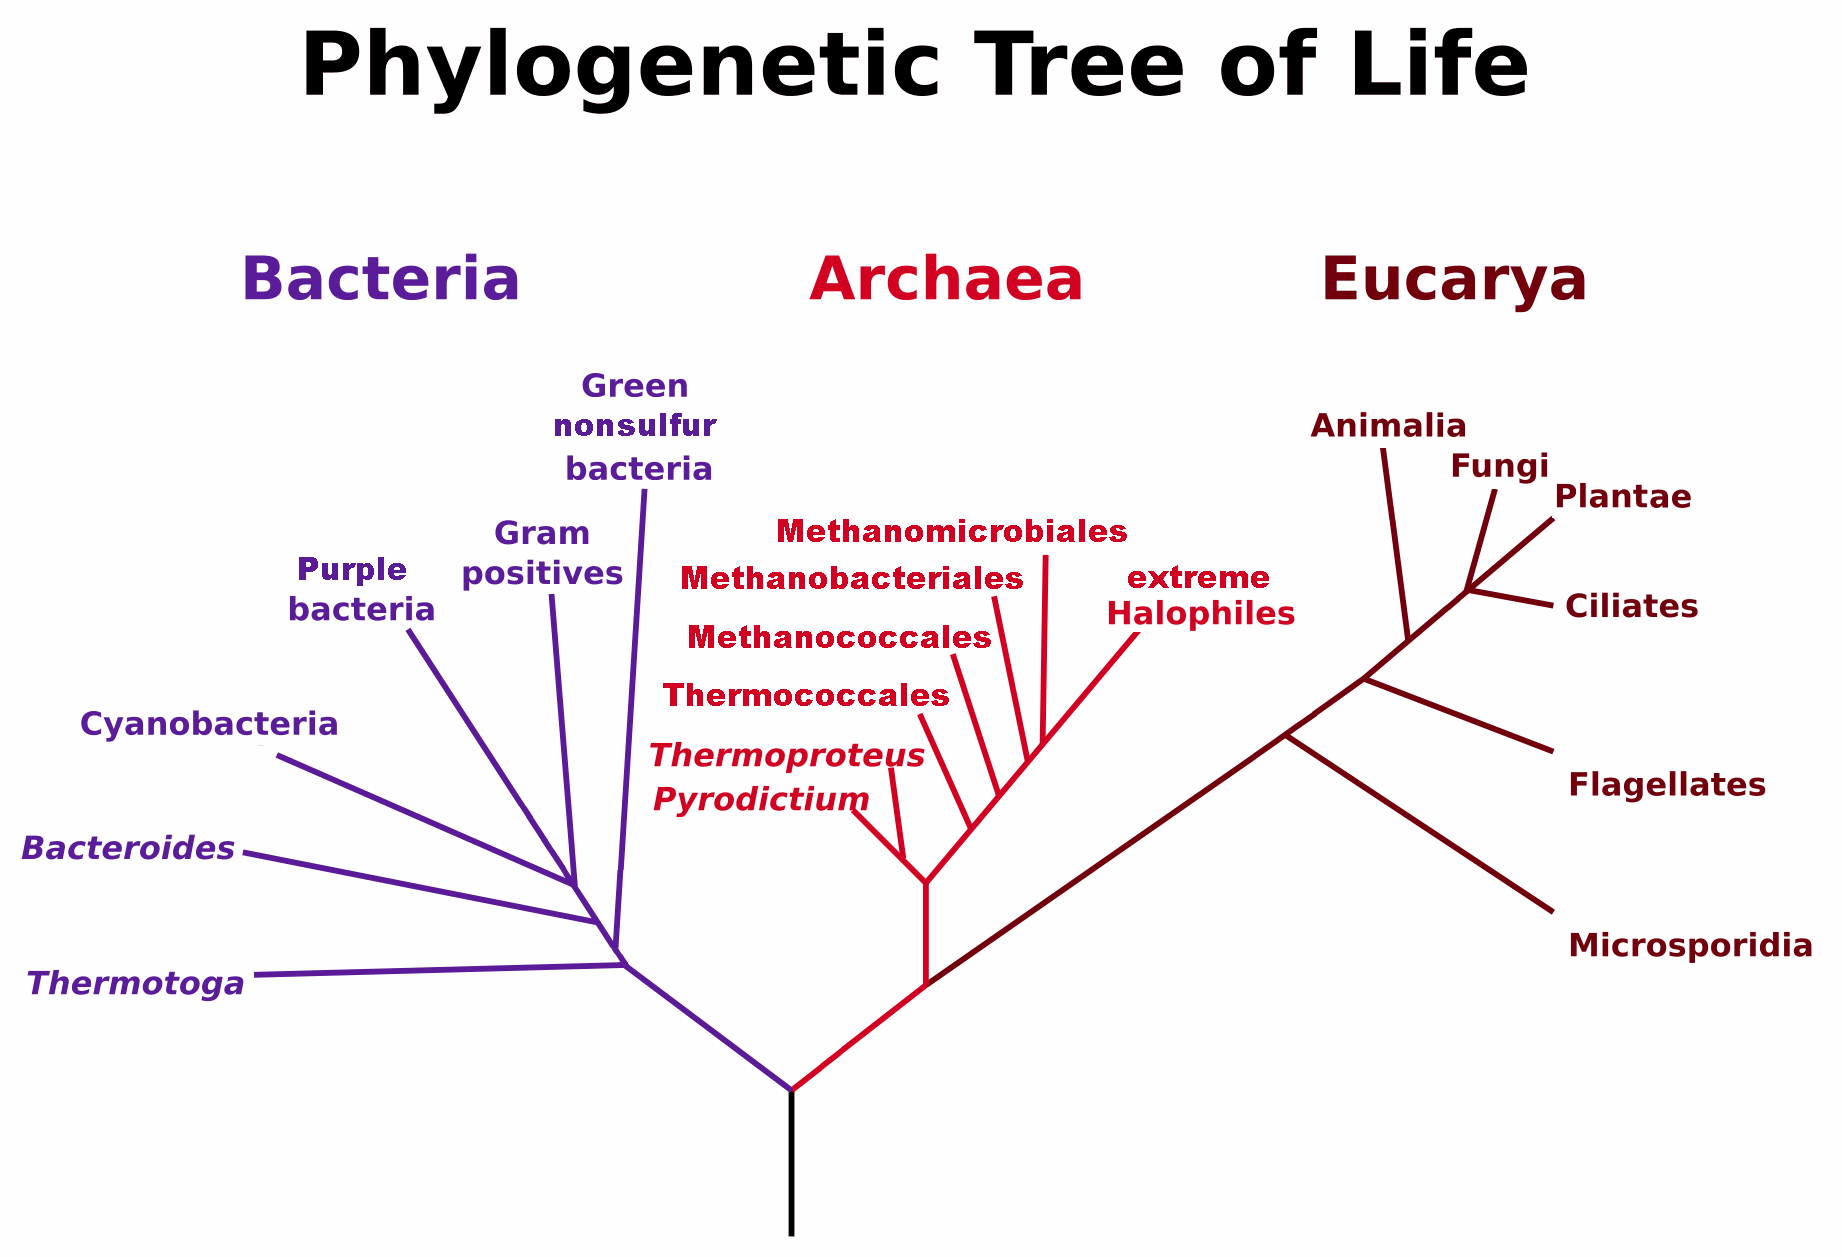
Figure 3.3.2 Image Description
The image shows a phylogenetic tree of life, illustrating the evolutionary relationships among the three domains: Bacteria, Archaea, and Eucarya.
- Bacteria (left, in purple) includes groups such as Thermotoga, Bacteroides, Cyanobacteria, Purple bacteria, Gram positives, and Green nonsulfur bacteria.
- Archaea (center, in red) branches into lineages such as Methanomicrobiales, Methanobacteriales, Methanococcales, Thermococcales, Thermoproteus, Pyrodictium, and extreme halophiles.
- Eucarya (right, in dark red) contains major eukaryotic groups, including Animalia, Fungi, Plantae, Ciliates, Flagellates, and Microsporidia.
Each domain is colour-coded: purple for Bacteria, red for Archaea, and dark red for Eucarya. The tree emphasizes the common origin point at the root, showing how all life diverged into these three main domains.
The tree is supported by many lines of evidence, but it is probably not flawless. Scientists constantly re-evaluate hypotheses and compare them to new evidence. As scientists gather even more data, they may revise these particular hypotheses, rearranging some of the branches on the tree. For example, evidence discovered in the last 50 years suggests that birds are dinosaurs, which required an adjustment to several “vertebrate twigs.”
Understanding Phylogenetic Trees
The point where a split occurs in a tree, called a branch point, represents where a single lineage evolved into distinct new ones. Many phylogenetic trees have a single branch point at the base representing a common ancestor of all the branches in the tree. When two lineages stem from the same branch point, they are called sister taxa. A branch point with more than two groups illustrates a situation for which scientists have not definitively determined relationships. It is important to note that sister taxa share an ancestor, which does not mean that one taxon evolved from the other. The branch point, or split, represents a common ancestor that existed in the past but no longer exists.
How to Understand Phylogenetic Trees
The following diagram describes the different components of phylogenetic trees. Click on the Information tab in each box to learn more.
Text Description
- Understanding a phylogeny is a lot like reading a family tree. The root of the tree represents the ancestral lineage, and the tips of the branches represent the descendants of that ancestor. As you move from the root to the tips, you are moving forward in time.
- When a lineage splits (speciation), it is represented as branching on a phylogeny. When a speciation event occurs, a single ancestral lineage gives rise to two or more daughter lineages.
- Often, one sees phylogenies that include polytomies, nodes with more than two descendant lineages, creating a “pitchfork.” A polytomy may mean that we don’t have enough data to figure out how the lineages are related. Often, gathering more data can resolve a polytomy, or it may mean that multiple speciation events happened at the same time.
- Phylogenies trace patterns of shared ancestry between lineages. Each lineage has a part of its history that is unique to it alone and parts that are shared with other lineages.
- Similarly, each lineage has ancestors that are unique to that lineage and ancestors that are shared with other lineages — common ancestors.
- A clade is a grouping that includes a common ancestor and all the descendants (living and extinct) of that ancestor. Using a phylogeny, it is easy to tell if a group of lineages forms a clade. Imagine clipping a single branch off the phylogeny — all of the organisms on that pruned branch make up a clade. Clades are nested within one another — they form a nested hierarchy. A clade may include many thousands of species or just a few.
Knowledge Check
Text Description
- Brown bear
- Grey squirrel
- Spider monkey
- Humans
- Giant beaver
- Ancestor of bear and human
- Ancestor of squirrel and monkey
- Ancestor of human and monkey
- Pie-billed grebe
- Night heron
- Roadrunner
- Bohemian waxwing
- Arctic tern
- The species moved to opposite sides (i.e., the species on the left side moved to the right and vice versa).
- The piebilled grebe was no longer shown as being more closely related to the road runner and the night heron.
- Poison dart frog
- Horned owl
- Box turtle
- Reticulated python
- Tiger salamander
- Warm-blooded
- Amniotic egg
- Rib-fused shell
- Hard-shelled eggs
- Cutaneous breathing
- Horned owl
- Poison dart frog
- Reticulated python
- Tiger salamander
- Box turtle
Answers:
a. Brown bear
a. Ancestor of bear and human
d. Bohemian waxwing; e. Arctic tern;
b. The piebilled grebe was no longer shown as being more closely related to the road runner and the night heron.
a. Poison dart frog; e. Tiger salamander;
b. Amniotic egg
c. Reticulated python
“12.1 Organizing Life on Earth” from Biology and the Citizen by Colleen Jones is licensed under a Creative Commons Attribution 4.0 International License, except where otherwise noted. Modifications: Edited and reworded
