8.3 Mendelian Inheritance
Monohybrid Cross
A Punnett Square chart allows you to easily determine the expected ratios of possible genotypes in the offspring of two parents. You can see a simple example in Figure 8.3.1. This Punnett square is for a monohybrid cross when fertilization occurs between two parents that differ by only one character. In this case, both parents are yellow and are heterozygotes (Yy) for the gene controlling pea colour. Half of the gametes produced by each parent will have the Y allele (for yellow), and half will have the y allele (for green). That’s because the two alleles are on homologous chromosomes, which always separate and go to separate gametes during meiosis. The alleles in the gametes from each parent are written down the side and across the top of the Punnett square. Filling in the cells of the Punnett square gives the possible genotypes of their offspring. It also shows the most likely ratios of the genotypes, which in this case is 1 YY: 2 Yy: 1 yy (25% YY: 50% Yy: 25% yy). You can then determine the most likely ratios of the phenotypes, which is three yellow: 1 green (75% yellow: 25% green).
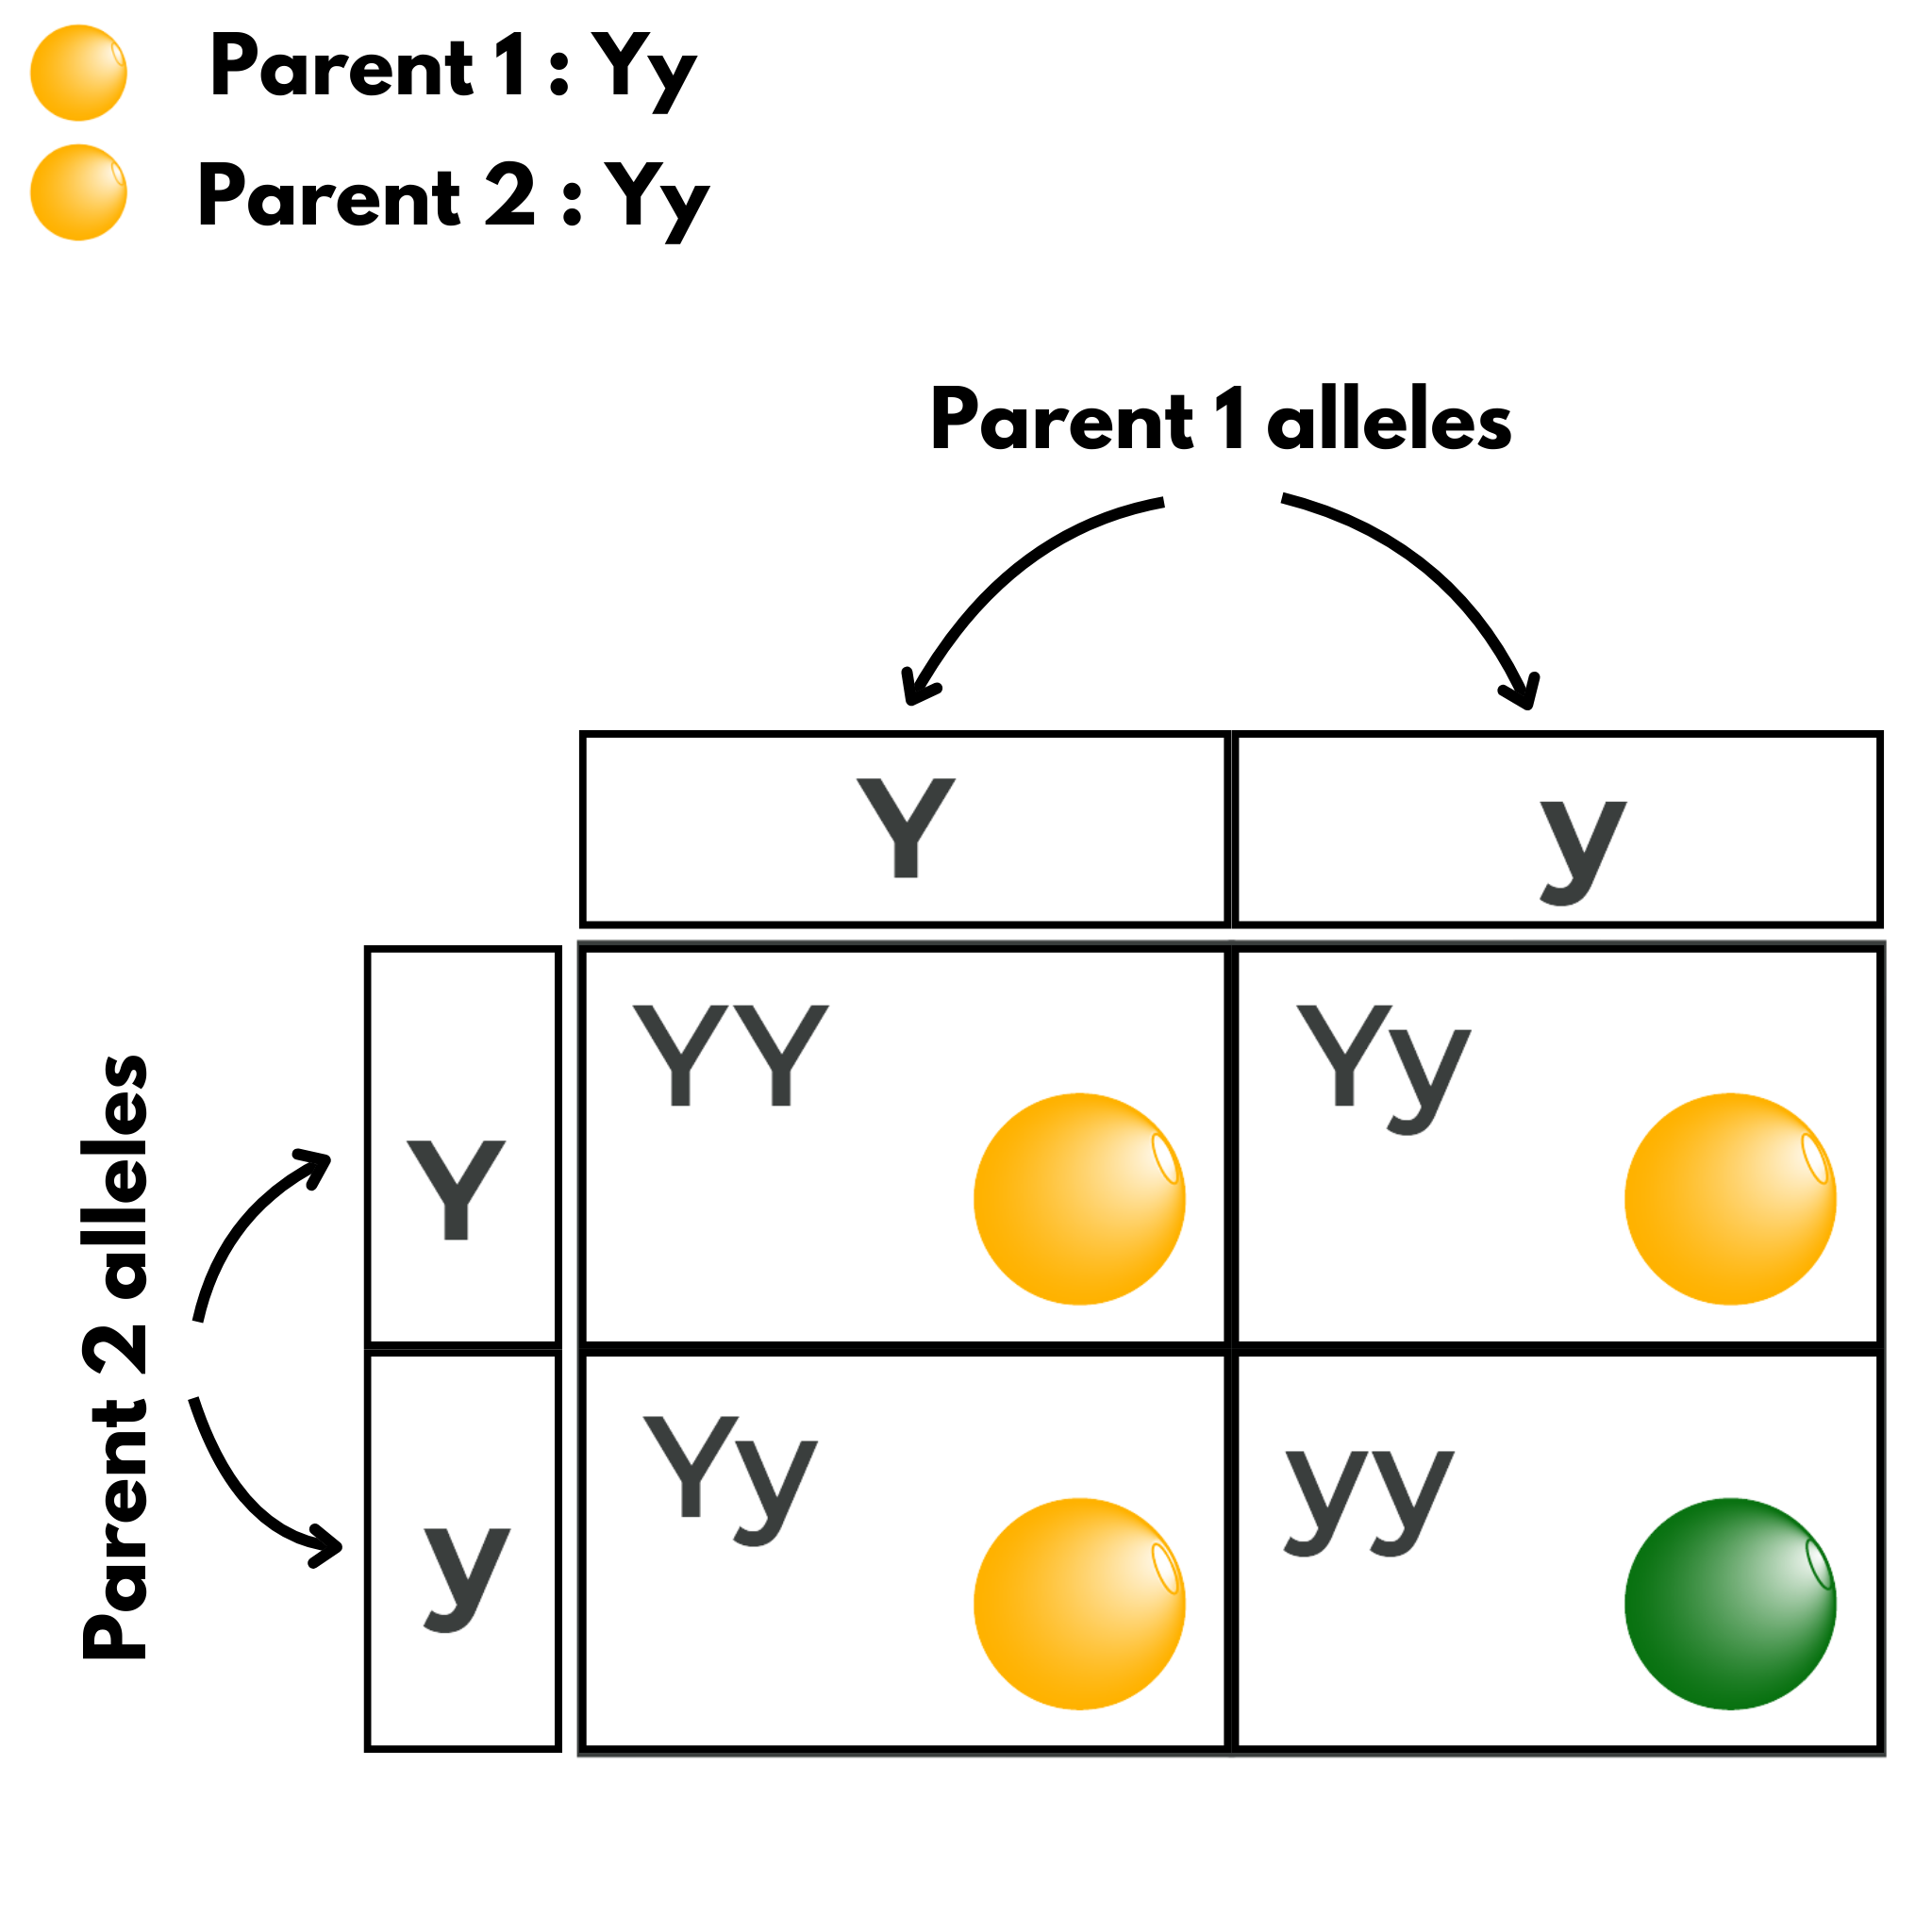
Figure 8.3.1 Description
A Punnett square diagram illustrating a genetic cross between two heterozygous pea plants for seed colour. Each parent has one dominant allele (Y) for yellow seeds and one recessive allele (y) for green seeds. The Punnett square shows four possible combinations of offspring genotypes: YY, Yy, Yy, and yy. Three of the squares result in yellow seeds (YY and Yy), and one results in green seeds (yy). The expected phenotypic ratio is 3 yellow to 1 green. Yellow and green seed images are used to represent the traits.
A Punnett square can also be used to show how the X and Y chromosomes are passed from parents to their children. Mothers pass only X chromosomes to their children. Fathers always pass their X chromosome to their daughters and their Y chromosome to their sons.
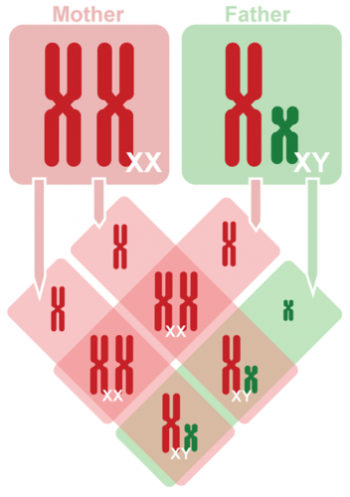
Figure 8.3.2 Description
A diagram showing sex chromosome inheritance using a Punnett square. The mother (XX) contributes only X chromosomes, while the father (XY) contributes either an X or a Y chromosome. The square illustrates four possible combinations: two XX (female) and two XY (male). This results in a 50/50 chance of offspring being female or male. The mother’s chromosomes are shown in red and the father’s in green, with the resulting offspring combinations displayed in pink and green boxes.
Exercise 8.3.1
Text Description
- Aa
- Aa
- aa
- aa
Genotypes:
- Aa
- aa
- AA
- Aa
- Aa
From the bottom left of Punnett Square to the bottom right
- aa
- aa
Probability Basics
The results of Mendel’s research can be explained in terms of probabilities, which are mathematical measures of likelihood. The probability of an event is calculated by the number of times the event occurs divided by the total number of opportunities for the event to occur. A probability of one (100 percent) for some event indicates that it is guaranteed to occur. In contrast, a probability of zero (0 percent) indicates that it is guaranteed not to occur, and a probability of 0.5 (50 percent) means it has an equal chance of occurring or not occurring.
Figure 8.3.1 shows a 25% chance of getting the genotype yy. That does not guarantee that there will be one yy pea plant out of every 4 offspring. Sample size plays a crucial role in observing these probabilities. In smaller sample sizes, the actual outcomes may deviate from the expected probabilities due to random chance. When flipping a coin, you have a 50% chance of getting heads and a 50% chance of tails. If you flip a coin 2 times, you aren’t guaranteed to get 1 heads and 1 tail. However, as the sample size increases, the observed ratios align more closely with the predicted probabilities. By flipping a coin 1000 times, you have a much better chance of observing the predicted ratios of 50% heads and 50% tails. Similarly, for genetics, there is a higher likelihood of observing the expected 25% yy genotype when considering a large number of offspring.
Dihybrid Cross
A dihybrid cross is when fertilization occurs between parents that differ by two characters. Consider the characteristics of seed colour and seed shape for two pea plants, one that has wrinkled, green seeds (rryy) and another that has round, yellow seeds (RRYY). Because each parent is homozygous, the law of segregation indicates that the gametes for the wrinkled–green plant are all ry, and the gametes for the round–yellow plant are all RY. Therefore, the F1 offspring generation is all RrYy (Figure 8.10).
The gametes produced by the F1 individuals must have one allele from each of the two genes. For example, a gamete could get an R allele for the seed shape gene and either a Y or a y allele for the seed colour gene. It cannot get an R and an r allele; each gamete has only one allele per gene. The law of independent assortment states that a gamete into which an r allele is sorted would be equally likely to contain either a Y or a y allele. Thus, there are four equally likely gametes that can be formed when the RrYy heterozygote is self-crossed: RY, rY, Ry, and ry. Arranging these gametes along the top and left of a 4 × 4 Punnett square gives us 16 equally likely genotypic combinations. These genotypes show a phenotypic ratio of 9 round–yellow: 3 round–green: 3 wrinkled–yellow: 1 wrinkled–green. These are the offspring ratios we would expect, assuming we performed the crosses with a large enough sample size.
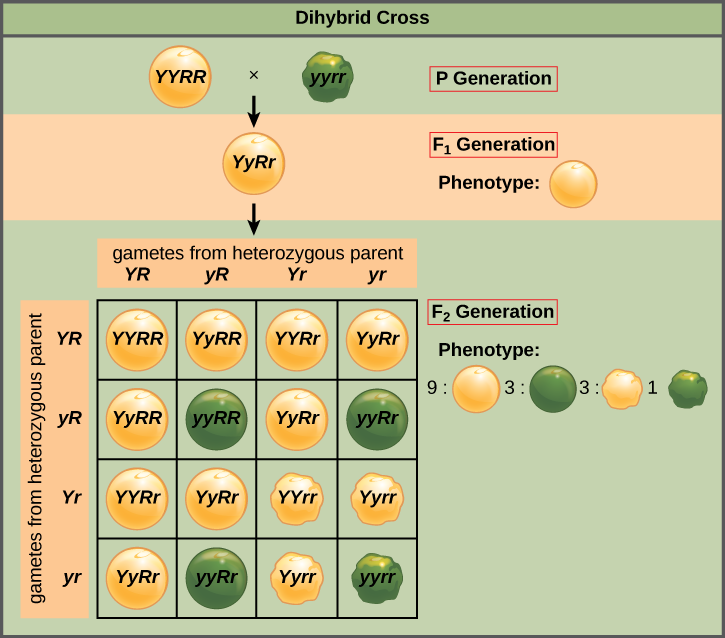
Figure 8.3.3 Description
A diagram of a dihybrid cross illustrating the inheritance of two traits in pea plants: seed colour (yellow or green) and seed shape (round or wrinkled). The parental generation (P) consists of a plant with yellow round seeds (YYRR) crossed with one with green wrinkled seeds (yyrr). The first generation (F₁) is entirely heterozygous (YyRr) with yellow round seeds. A Punnett square for the F₂ generation shows the 16 possible offspring combinations from two YyRr parents. The resulting phenotypic ratio is shown as 9:3:3:1 — 9 yellow round, 3 green round, 3 yellow wrinkled, and 1 green wrinkled.
Exercise 8.3.2
Text Description
- Ry
- ry
- RY
- rY
3. Select all of the possible gametes for a parent that has the genotype RRYy
- RY
- Ry
- ry
- rY
4. Since one of the parents only has 2 possible gametes, that means that we get to make a simplified Punnett square with 4 boxes by 2 boxes. Fill in the genotypes for the offspring
Drop Zones:
- RY, RY
- Ry, RY
- rY, RY
- ry, RY
- RY, Ry
- Ry, Ry
- rY, Ry
- ry, Ry
Possible Options:
- RRYY
- RRYy
- RrYY
- RyYy
- RRYy
- RRyy
- RrYy
- Rryy
5. Drag in the corresponding phenotypes
Drop Zones:
- RY, RY
- RY, Ry
- RY, rY
- RY, ry
- Ry, RY
- Ry, Ry
- Ry, rY
- Ry, ry
Images:
- Smooth Yellow Pea
- Smooth Green Pea
- Wrinkled Yellow Pea
- Wrinkled Green Pea
Zone RY, Ry: Smooth Yellow Pea
Zone RY, rY: Smooth Yellow Pea
Zone RY, ry: Smooth Yellow Pea
Zone Ry, RY: Smooth Yellow Pea
Zone Ry, Ry: Smooth Green Pea
Zone Ry, rY: Smooth Yellow Pea
Zone Ry, ry: Smooth Green Pea
Mendelian Inheritance in Humans
Mendelian inheritance refers to the inheritance of traits controlled by a single gene with two alleles, one of which may be completely dominant to the other. The inheritance pattern of Mendelian traits depends on whether the traits are controlled by genes on autosomes or by genes on sex chromosomes.
Autosomal Traits
Autosomal traits are controlled by genes on one of the 22 pairs of human autosomes. Autosomes are all the chromosomes except the sex chromosomes (X and Y). Autosomes do not differ between males and females, so autosomal traits are inherited similarly, regardless of the parent’s sex or offspring.
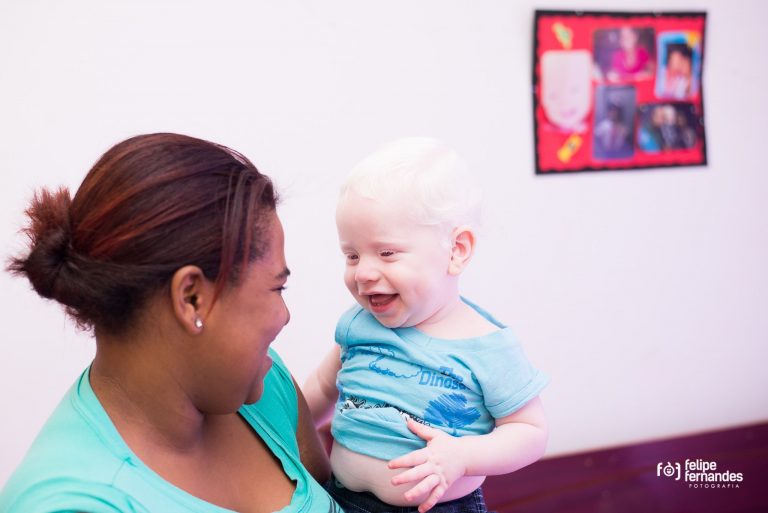
Not many human autosomal traits are controlled by a single gene with two alleles, but they are a good starting point for understanding human heredity. Most forms of albinism in humans have a Mendelian inheritance pattern. Albinism is a condition that results from a lack of pigment melanin in the skin, hair, and eyes. It is usually controlled by a single autosomal gene with two alleles. The allele for normal pigmentation (let’s call it R) is dominant to the allele for albinism (r). Individuals with an RR or Rr genotype will not have albinism because the R allele dominates over the recessive r allele.
However, consider what happens if two individuals with the Rr genotype reproduce with each other. The outcome would be similar to the example shown in the Punnett square above for two hypothetical Yy individuals (Figure 8.3.1). Their possible offspring could be RR (normal pigmentation), Rr (normal pigmentation), or rr (albinism). This explains why a child with albinism (rr) can have two parents who do not have albinism. Both unaffected parents must be carriers of the recessive r allele, but they also have a dominant R allele that prevents them from having the condition themselves.
Some other human traits with a Mendelian inheritance pattern are Huntington’s disease and wet versus dry earwax. You may have heard about other human traits that were previously thought to be Mendelian, such as dimples, a widow’s peak hairline, a hitchhiker’s thumb, and the ability to roll your tongue. As science has progressed, it is now understood that these are not actually Mendelian traits. In fact, most human traits are controlled by multiple genes or have more than two alleles, which means they do not have a simple Mendelian inheritance pattern.
Sex-Linked Traits
Traits controlled by genes on the sex chromosomes are called sex-linked traits. Because of the small size of the Y chromosome, most sex-linked traits are controlled by genes on the X chromosome. These traits are called X-linked traits.
Because males have just one X chromosome, they have only one allele for any X-linked trait. Therefore, a recessive X-linked allele is always expressed in males. Because females have two X chromosomes, they have two alleles for any X-linked trait. Therefore, they must inherit two copies of the recessive allele to express an X-linked recessive trait. This explains why X-linked recessive traits are less common in females than males and why they show a different inheritance pattern than autosomal traits.
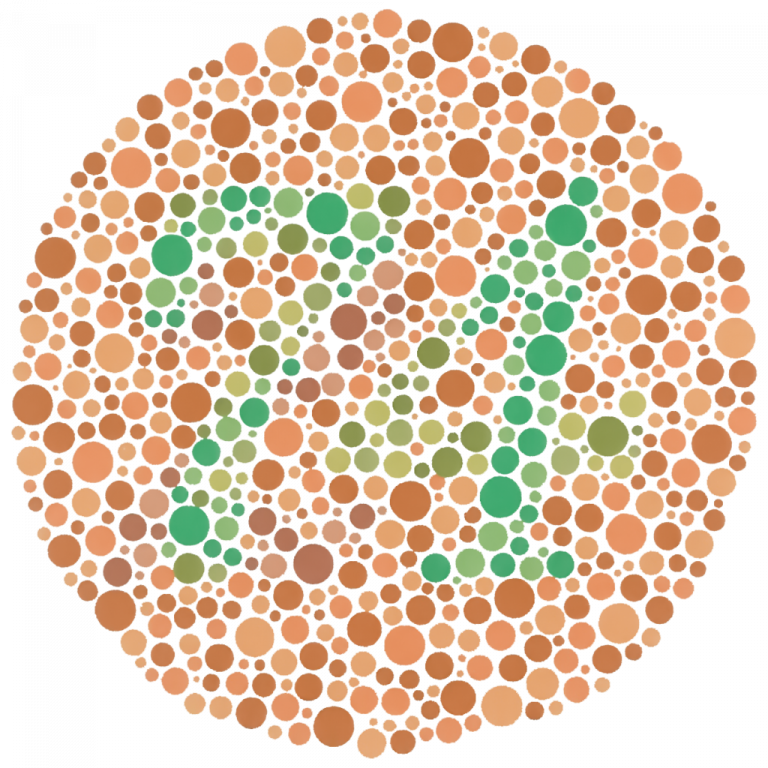
An example of a recessive X-linked trait is red-green colour blindness. People with this trait cannot distinguish between the colours red and green. More than one recessive gene on the X chromosome codes for this trait, which is fairly common in males but relatively rare in females. Figure 8.3.6 shows a simple pedigree for this trait. A female with one of the recessive alleles for the trait does not have the trait herself but can pass it on to her children. In this case, she is called a carrier of the trait. Half of any sons she has can be expected to have the trait because there is a 50 percent chance that they will inherit the X chromosome with the colour-blindness allele. Having only one X chromosome, the recessive allele will be expressed in the sons who inherit it. However, as long as the father is not affected, none of the woman’s daughters will have the trait. The daughters have a 50 percent chance of inheriting the X chromosome with the colour-blindness allele, but it won’t be expressed because it is recessive to the normal allele they inherit from their father.
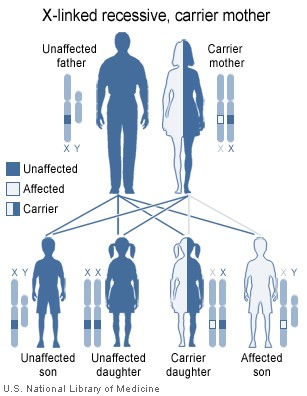
Figure 8.3.6 Description
A genetic inheritance chart illustrating an X-linked recessive condition passed from a carrier mother and an unaffected father. The father has normal XY chromosomes, and the mother has one affected X chromosome (X*) and one normal X chromosome. The chart shows the four possible children: an unaffected son (XY), an unaffected daughter (XX), a carrier daughter (XX), and an affected son (XY). Sons inherit their X chromosome from their mother and Y from their father, while daughters inherit one X from each parent. The diagram highlights how sons can be affected if they inherit the X* from the carrier mother.
Genetic Disorders
Some human genetic disorders follow Mendelian inheritance patterns. Table 8.3.1 lists several genetic disorders caused by mutations in just one gene. Some of the disorders are caused by mutations in autosomal genes, others by mutations in X-linked genes.
|
Genetic Disorder |
Direct Effect of Mutation |
Signs and Symptoms of the Disorder |
Mode of Inheritance |
|---|---|---|---|
| Marfan syndrome | Defective protein in connective tissue | Heart and bone defects and unusually long, slender limbs and fingers | Autosomal dominant |
| Sickle cell anemia | Abnormal hemoglobin protein in red blood cells | Sickle-shaped red blood cells that clog tiny blood vessels, causing pain and damaging organs and joints | Autosomal recessive |
| Hypophosphatemic (Vitamin D-resistant) rickets | Lack of a substance needed for bones to absorb minerals | Soft bones that easily become deformed, leading to bowed legs and other skeletal deformities | X-linked dominant |
| Hemophilia A | Reduced activity of a protein needed for blood clotting | Internal and external bleeding that occurs easily and is difficult to control | X-linked recessive |
A dominant disorder is caused by a mutated dominant allele. Very few genetic disorders are controlled by dominant alleles. A dominant allele is expressed in every individual who inherits even one copy of it. If it causes a serious disorder, affected people may die young and fail to reproduce. Therefore, the mutant dominant allele will likely die out of a population.
A recessive disorder, such as sickle cell anemia or cystic fibrosis, is not expressed in people who inherit just one copy of it. These people are called carriers. They do not have the disorder themselves, but they carry the mutant allele, and their offspring can inherit it. Thus, the allele will likely pass on to the next generation rather than die out.
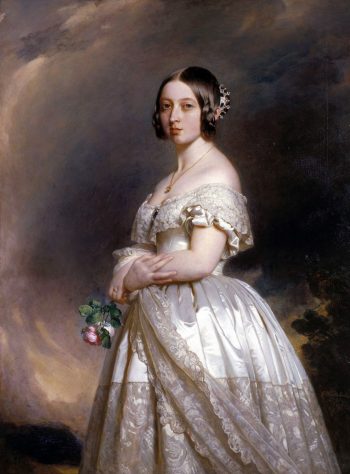
Queen Victoria carried hemophilia and passed the hemophilia allele to two of her daughters. When they married royalty in other European countries, they spread the allele across Europe, including the royal families of Spain, Germany, and Russia. Victoria’s son, Prince Leopold, also inherited the hemophilia allele from his mother, and he suffered from the disease. Understandably, hemophilia was once popularly called “the royal disease.”
Studying Inheritance Patterns
A pedigree shows how a trait is passed from generation to generation within a family. A pedigree can show, for example, whether a Mendelian trait is an autosomal or X-linked trait. It can also be used to infer the genotype of different family members. Pedigrees can also be used to track the inheritance of genetic disorders within families.
The trait represented by this chart is a hypothetical autosomal trait controlled by a dominant allele. At the top of the pedigree, you can see symbols representing a married couple. The husband has the trait (affected male), but the wife does not (unaffected female). The next row of the pedigree shows the couple’s children, as well as the spouses of three of the children. For example, the first child on the left is an affected male married to an unaffected female. The third row of the pedigree shows the next generation (the couple’s grandchildren at the top of the pedigree). One child in this generation — the affected female on the left — is the sibling of an unaffected male.
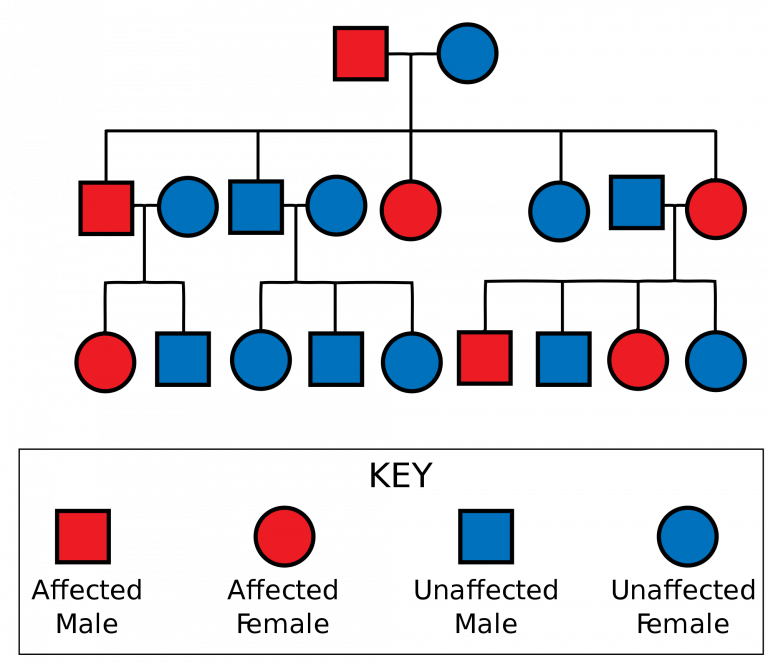
Figure 8.3.8 Description
A pedigree chart showing the inheritance of a genetic trait through multiple generations. Squares represent males and circles represent females. Red shapes indicate individuals affected by a genetic condition, and blue shapes represent unaffected individuals. The chart spans four generations, with connecting lines indicating parental relationships and offspring. The trait appears to affect both males and females, suggesting an autosomal (non-sex-linked) inheritance pattern. The condition shows up in every generation, which may indicate a dominant trait.
Exercise 8.3.3
Text Description
A chart that allows you to easily determine the expected ratios of possible genotypes of the offspring of two parents is a ____.
Chromosomes which do not code for gender are called ____.
The X and Y chromosomes are the ____ and these carry sex-linked traits, including ____.
Possible Answers
- pedigree
- sex chromosomes
- hemophilia and colour blindness
- Punnett Square
- autosomal chromosomes
2. Women are more likely than men to have X-linked diseases. (True/False)
3. Most human autosomal traits are controlled by a single gene with two alleles, similar to Mendel’s pea plant. (True/False)
4. A man and a woman have known genotypes and you want to predict the possible genotypes of their offspring. Which is the best tool?
- Punnett Square
- Pedigree
5. You want to document which members of your family had or have breast cancer.
- Punnett Square
- Pedigree
A chart that allows you to easily determine the expected ratios of possible genotypes of the offspring of two parents is a Punnett Square.
Chromosomes which do not code for gender are called autosomal chromosomes.
The X and Y chromosomes are the sex chromosomes and these carry sex-linked traits, including hemophilia and colour blindness.
2. False
3. False
4. Punnett Square
5. Pedigree
“5.13 Mendelian Inheritance” from Human Biology by Christine Miller is licensed under a Creative Commons Attribution-NonCommercial 4.0 International License, except where otherwise noted.
“Monohybrid Cross and the Punnett Square” from Principles of Biology by Catherine Creech is licensed under a Creative Commons Attribution 4.0 International License, except where otherwise noted.
“8.2 Laws of Inheritance” from Biology and the Citizen by Colleen Jones is licensed under a Creative Commons Attribution 4.0 International License, except where otherwise noted.
“5.15 Genetic Disorders” from Human Biology by Christine Miller is licensed under a Creative Commons Attribution-NonCommercial 4.0 International License, except where otherwise noted
