Most of us enjoy the taste of sweetness, but you’ve also probably heard that you shouldn’t eat too much sugar. Maybe you’ve even heard that sugar is toxic. The truth about sugar is more complex. It’s true that most Americans eat more added sugar than recommended and would benefit from cutting back. It’s also true that added sugars are hidden in many foods, and it can take savvy label-reading to find them. But let’s also remember the big picture when we think about sugar. Some sugar is naturally-occurring in whole foods, packaged with other valuable nutrients. There’s also room in the diet for some added sugar, and it can be valuable for making nutrient-dense foods more palatable or just for the pleasure of enjoying a treat. Let’s look closer at the role of sugar in the diet.
Food Sources of Naturally-Occurring and Added Sugars
As we’ve already discussed, sugars are naturally found in fruits, veggies, and dairy. These are nutrient dense foods that come packaged with other essential nutrients too.

Figure 4.29. Examples of food that contain naturally occuring sugars: fruit, vegetables, and dairy.
Fresh fruits and veggies contain naturally-occurring sugars like glucose, fructose, and sucrose, but also come packaged with fiber, potassium, and Vitamin C. Dairy foods like unsweetened yogurt, milk, and cheese contain naturally-occurring lactose but also come packaged with calcium, potassium, phosphorus, and riboflavin.
Another food that contains natural sugar in the form of maltose is sprouted grain bread. In the example below, the only ingredients are sprouted organic rye kernels and water, yet there are 7 grams of sugar per slice. This sugar must be naturally-occuring maltose, and as you can imagine, it comes packaged with nutrients like fiber, protein, and iron.


Figure 4.30. An example of a sprouted wheat bread that contains naturally occuring maltose from sprouted rye kernels.
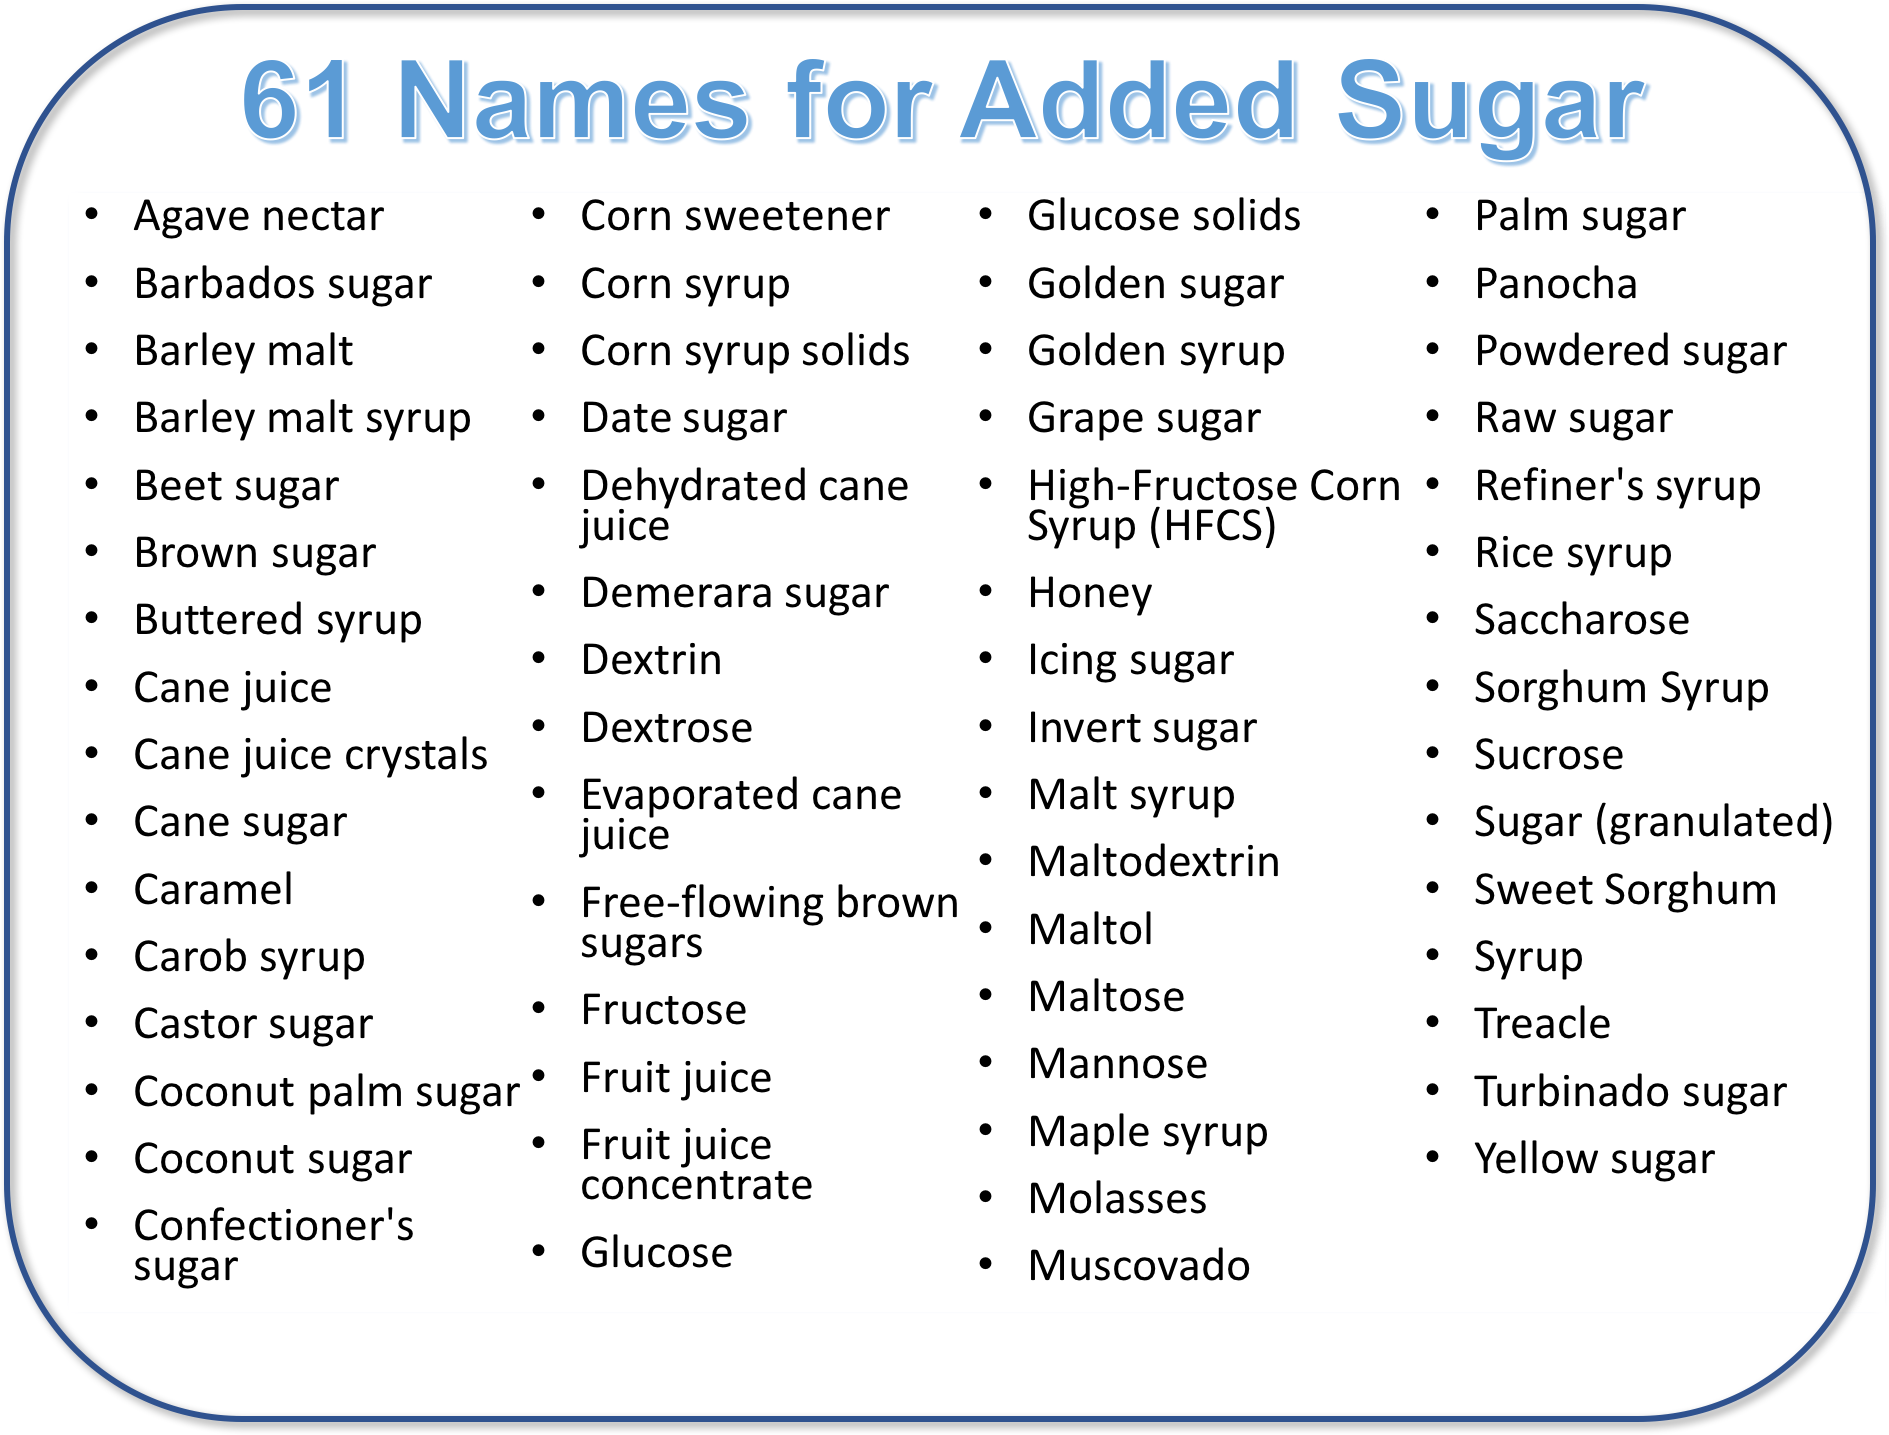
In contrast, added sugars are concentrated sweeteners that are added as ingredients to foods to make them sweeter. They add calories to a food but contribute little to no essential nutrients, so they decrease the nutrient density of foods. Among the most common sources of added sugar are table sugar (sucrose) and high fructose corn syrup, but they come in many different forms with different names. For example, honey, maple syrup, agave nectar, and brown rice syrup may all sound more wholesome and natural, but they’re still added sugars, because they are concentrated sweeteners that contribute little to no other nutrients. Other names for added sugar you might not recognize as sweeteners at all, like barley malt or treacle. Here’s a list of 61 different names for added sugars:

Figure 4.31. Names of sugar commonly added to food.
We find added sugars in some expected places, like cookies, ice cream, and soda, but there can also be a surprising amount of added sugar in yogurt, breakfast cereals, energy bars, and plant-based milk alternatives, like soy milk. We also find added sugars hiding in unexpected places, like ketchup, salad dressings, bread, and pasta sauce. In fact, nearly 75% of packaged products in the U.S. food supply are now sweetened.
In general, most people don’t need to worry much about how much naturally-occurring sugar they consume. This goes back to the fact that naturally-occurring sugars are packaged with other nutrients. For example, a large apple contains about 23 grams of sugar, more than half of it in the form of fructose.1 However, it also has more than 5 grams of fiber, plus a significant amount of vitamin C and potassium. The fiber slows down the digestion and absorption of the sugar into your bloodstream, giving your body more time to metabolize it and giving you a greater feeling of fullness.
A single can of soda, on the other hand, contains about 33 grams of sugar.1 It’s in a similar chemical form as the sugar in the apple—a mix of fructose and glucose—but it’s not accompanied by any fiber to slow down digestion. Therefore, it’s rapidly absorbed into your bloodstream, and your body has to quickly metabolize the fructose to glucose and increase insulin secretion to process the spike in sugar. Plus, although the soda contains 150 calories and the apple has just 116, the apple is probably going to leave you feeling more satisfied and less hungry compared with the soda.
For all of these reasons, it’s the added sugars that we worry about, not the naturally-occurring ones. That said, there is room for some added sugar in a balanced diet, and you can use it to make nutrient-dense food tastier. For example, you can drizzle honey into plain yogurt or sprinkle some brown sugar on roasted winter squash. You get far more nutritional “bang for your buck” using added sugars in this way than consuming them in something like a soda. (And of course, there’s also room in a balanced diet for occasional treats!)
How much added sugar are we eating?
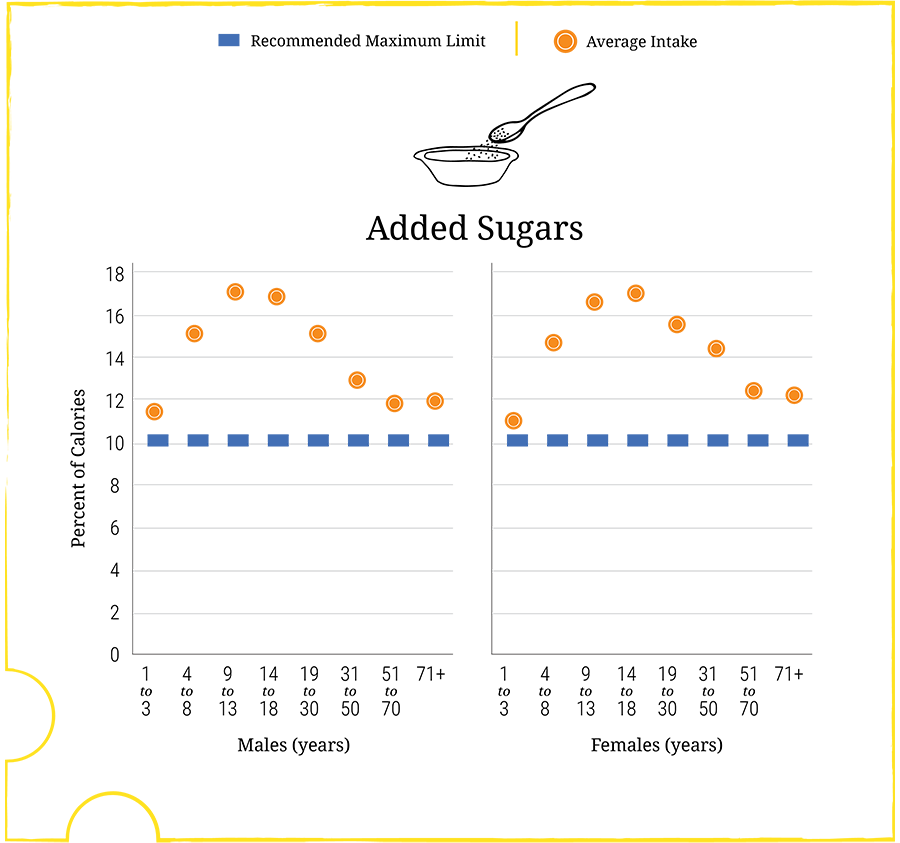
On average, Americans consume 22 to 30 teaspoons of added sugar daily, up to 17% of calories, well in excess of the recommendation to limit added sugar intake to 10% of calories or less. This is shown in the image below from the Dietary Guidelines.

Figure 4.32. Average intakes of added sugars as a percent of calories per day by age-sex group, in comparison to the Dietary Guidelines’ maximum limit of less than 10 percent of calories.
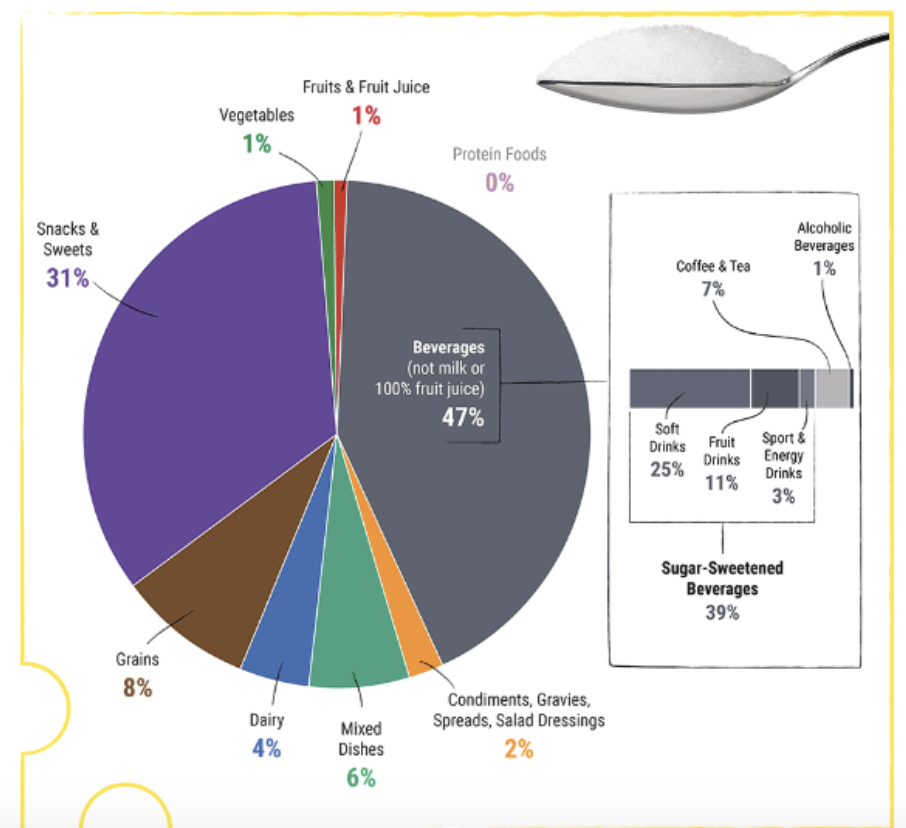
Where are all of these added sugars coming from? Nearly half of them come from soda, juices, and other sugary drinks, as illustrated below. Therefore, the Dietary Guidelines recommend that people drink more water and less sugary drinks.

Figure 4.33. Food category sources of added sugars in the U.S. population ages 2 years and older.
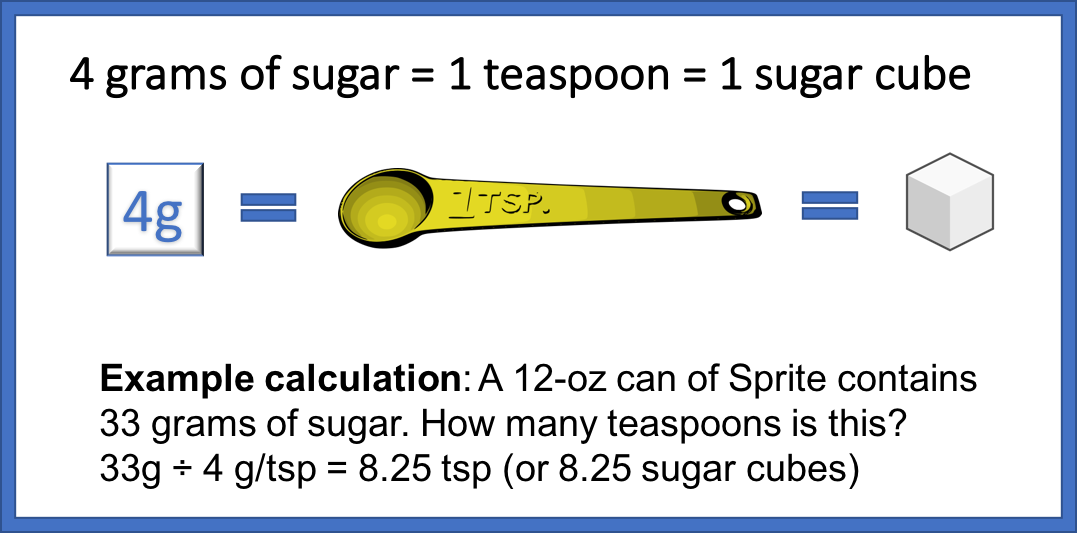
On the Nutrition Facts panel, sugar is expressed in grams, but most of us don’t think in grams. Therefore, it can be helpful to convert gram amounts to teaspoons, which are easier to visualize. Use the conversions shown in the graphic below to make these calculations.

Figure 4.34. One teaspoon is equal to 4 grams of sugar or a sugar cube.
The sugar in soda adds up fast, especially with our super sized portions. For example, a 64-ounce soda has 186 grams of sugar, or about 46 teaspoons. (186 grams divided by 4g/tsp = 46 teaspoons.)

Figure 4.35. Forty six sugar cubes stacked next to a big gulp to illustrate the 46 teaspoons of sugar that the soda contains.
It can be eye-opening to track your added sugar intake for a few days, and this may give you an idea of sources of added sugar that you can live without and replace with something else. However, tracking added sugar intake can be tedious. In the big picture, it’s most important to focus on eating whole foods that are minimally processed and to consume added sugars in moderation.
Benefits of Eating Less Added Sugar
Research shows that adopting an eating pattern that is relatively low in added sugars has many benefits, including a lower risk of:
- Cardiovascular disease
- Obesity
- Type 2 diabetes
- Some cancers
- Dental cavities
Why does too much added sugar cause health problems? The reasons are complex, and this is an ongoing area of research and controversy. One possible explanation is that a diet high in added sugar means the pancreas has to work hard to make enough insulin, and over time, it can begin to fail and the body’s cells start to become insulin resistant. The liver also has to work hard to metabolize fructose, and too much fructose increases fat synthesis, which can raise blood lipid and cholesterol levels, increasing risk of heart disease.
Both dietary sucrose and starch are associated with tooth decay. Bacteria living in the mouth can utilize the carbohydrates passing through the oral cavity for their own benefit. Those bacteria happily metabolize carbohydrates, especially sucrose, but also starchy foods, which stick to teeth and linger there. Acid is formed in the process, and this can dissolve your tooth enamel, eventually causing cavities, also known as dental caries. Reducing sugar intake, limiting between-meal snacks, and brushing after meals to remove lingering carbohydrates can help reduce the risk of dental caries. The use of fluoride and regular dental care also help.

Fig. 4.36. Dental caries are formed because of a combination of factors: the presence of oral bacteria; a supply of sugar and/or starch for them to eat; tooth surface where they can form colonies, or plaque; and time.
Are Some Added Sugars Better Than Others?
Students often ask which sugar is healthiest: high fructose corn syrup, honey, agave syrup, or sugar? In general, as far as the body is concerned, sugar is sugar. These are all concentrated sweeteners that contain calories with very few/no other nutrients, so all should be used only in moderation.
High fructose corn syrup (HFCS) has gotten a lot of attention in the last several decades and has been blamed for the obesity epidemic and many other poor health outcomes. This is in part because it’s widely used to sweeten soda and so has become a large part of the American diet. It’s true that fructose is more work for the body to process, because it has to be converted to glucose. Here’s what the website Sugar Science, written by researchers and scientists from the University of California, San Francisco, has to say about the difference between table sugar and high fructose corn syrup:
“Table sugar (sucrose), derived from sugar cane and beets, is made up of equal portions of two types of sugars. It’s half (50%) glucose and half (50%) fructose. High-fructose corn syrup (HFCS) is derived from corn syrups that have undergone enzymatic processing to convert some of their glucose into fructose to produce a desired sweetness. HFCS comes in different formulations, depending on the manufacturer. More common formulations contain 42% fructose or 55% percent, but some contain as much as 90%. Why should we care? First, because there is significant evidence that fructose is processed differently in the body than other sugars and can be toxic to the liver, just like alcohol. Second, because as a nation, we have been consuming more of our sugars in HFCS over time.”
But focusing too much attention on fructose as the problem may risk missing the forest for the trees. Here’s what Dr. Luc Tappy, a fructose researcher at University of Lausanne, had to say about the issue in an article on Vox.com:
“Given the substantial consumption of fructose in our diet, mainly from sweetened beverages, sweet snacks, and cereal products with added sugar, and the fact that fructose is an entirely dispensable nutrient, it appears sound to limit consumption of sugar as part of any weight loss program and in individuals at high risk of developing metabolic diseases. There is no evidence, however, that fructose is the sole, or even the main factor in the development of these diseases, nor that it is deleterious to everybody, and public health initiatives should therefore broadly focus on the promotion of healthy lifestyles generally, with restriction of both sugar and saturated fat intakes, and consumption of whole grains, fresh fruits and vegetables rather than focusing exclusively on reduction of sugar intake.”
Video: “What’s The Difference Between Sugar and High Fructose Corn Syrup?” by Reactions, YouTube (March 23, 2015), 2:41 minutes.
Are sweeteners such as honey, maple syrup, and molasses any better than more refined and processed sweeteners? Maybe. These sweeteners do contain minerals and antioxidants, so they may offer a slight edge in terms of nutrition. However, keep in mind that minerals and antioxidants are abundant in whole foods such as whole grains, vegetables, and fruits, and these obviously offer many other benefits. These sweeteners are still considered sources of added sugar and should be used in moderation. That said, each of them offers different delicious flavors, and honey has the added benefit that it can be purchased locally, so there are good reasons to turn towards these products when you want to add some sweetness to your food.
Label-Reading to Identify Sugar
If you’re trying to figure out if a food is high in added sugar and what ingredients are contributing the added sugar, there are two places you should look on the label. First, check the Nutrition Facts panel to see how many grams of added sugar are in one serving. Be aware that the “total sugars” on the label includes both added and naturally-occurring sugars. The ingredients list will identify the sources of added sugar, which may be listed as any of the 61 different names in the graphic high on this page.
Let’s take a look at some labels to practice identifying naturally occurring and added sugars in foods.
Below are labels from a 6-ounce serving of plain yogurt. There are 6 grams of total sugar and 0 grams of added sugar listed on the label. What ingredients contain naturally-occurring sugar?

Figure 4.37. Plain yogurt with Nutrition Facts and ingredient list.
The ingredients include nonfat milk, maltodextrin (a food additive that is a polysaccharide), milk protein concentrate, vitamins, and bacteria. There are no sources of added sugar in the ingredient list and zero grams of added sugar shown in the Nutrition Facts, so the 6 grams of total sugars are from naturally–occurring lactose in the milk.
Next, look at the label below for a 6-ounce serving of sweetened strawberry yogurt. There are 28 grams of total sugar and 21 grams of added sugar listed on the label. What ingredients are contributing naturally-occurring and added sugar in this product?

Figure 4.38. Strawberry yogurt with Nutrition Facts and ingredient list.
To answer this question, we again have to look at the ingredients list. Like the plain yogurt, the first ingredient is milk, but this strawberry yogurt also contains cane sugar and strawberries. Based on these ingredients, the added sugar comes from sucrose in cane sugar,and the naturally-occurring sugar is from the lactose from the milk and the glucose, fructose, and sucrose in the strawberries.
Not all yogurts are created equal, and many of them have less ingredients and less sugar than the example given above with the Greek yogurt. One example is siggi’s Icelandic style skyr. As you can see in the images below, the ingredients are simple, and there is a lot less sugar than traditional yogurts.

Figure 4.39. Siggi’s strawberry yogurt and Nutrition Facts.
In the siggi’s strawberry yogurt, a 5.3 oz (150g) serving has 11 grams of total sugar and 7 grams of added sugar. This is a combination of naturally-occurring sugar from the milk and strawberries and added sugar from the cane sugar. However, this product only has 7 grams of added sugar (just under 2 teaspoons), which is a lot less than the strawberry Greek yogurt with 21 grams of added sugar (just over 5 teaspoons) shown above. It is important to pay attention to labels when shopping for nutrient-dense foods.
Self-Check:
References:
- US Department of Health and Human Services and U.S. Department of Agriculture. (2015). Dietary Guidelines for Americans. Retrieved from https://health.gov/dietaryguidelines/2015/
- Institute of Medicine, Food and Nutrition Board. (2005). Dietary Reference Intakes for Energy, Carbohydrate, Fiber, Fat, Fatty Acids, Cholesterol, Protein, and Amino Acids (Macronutrients). Retrieved from https://www.nap.edu/read/10490/chapter/1
- Ng, S.W., Slining, M.M., & Popkin, B.M. (2012). Use of caloric and noncaloric sweeteners in US consumer packaged foods, 2005-2009. Journal of the Academy of Nutrition and Dietetics. 112(11), 1828-1834. e1-6. doi: 10.1016/j.jand.2012.07.009
- 1U.S Department of Agriculture, Agricultural Research Service, Nutrient Data Laboratory. (2014). USDA National Nutrient Database for Standard Reference, Release 27. Available at: http://www.ars.usda.gov/nutrientdata.
- Belluz and Zarracina. (2017). Sugar, explained. Vox. Retrieved from https://www.vox.com/science-and-health/2017/1/13/14219606/sugar-intake-dietary-nutrition-science
- Sugar Science, “Too Much Can Make Us Sick,” University of California, San Franciso, http://sugarscience.ucsf.edu/too-much-can-make-us-sick/#.W5lUKy-ZP-Y, accessed September 12, 2018.
- Whitaker, E.M., “The Sweet Science of Honey,” Sugar Science, UCSF, http://sugarscience.ucsf.edu/the-sweet-science-behind-honey.html#.W5qtp1InYdU, accessed September 13, 2018.
- Phillips, K.M., et al. (2009). Total antioxidant content of alternatives to refined sugar. J Am Diet Assoc. 109(1), 64-71. Retrieved from https://www.ncbi.nlm.nih.gov/pubmed/19103324
Image Credits:
- Figure 4.29. “Fruit” by Allen Gottfried is licensed under CC BY-SA 2.0; “vegetables” by johnbillu is licensed under CC BY-NC-ND 2.0; “Cheese” by Finite Focus is licensed under CC BY-NC 2.0
- Figure 4.30. “Sprouted bread and label” by Tamberly Powell is licensed under CC BY-NC-SA 4.0
- Figure 4.31. “61 Names for Added Sugar” by Alice Callahan is licensed under CC BY-NC-SA 4.0. Source for list of sugars: SugarScience, “Hidden in Plain Sight,” University of California, San Franscisco, http://sugarscience.ucsf.edu/hidden-in-plain-sight/#.W5li71Inbq0, accessed September 12, 2018.
- Figure 4.32 and Fig 4.33. “Added sugar intake graphics” from Dietary Guidelines for Americans, Figures 2-9 and 2-10 is in the public domain
- Figure 4.34. “Sugar conversion” by Alice Callahan is licensed under CC BY-NC-SA 4.0, “Sugar cube” by jhnri4 and “measuring spoon” by mazeo, both in the Public Domain
- Figure 4.35. “Big Gulp with sugar cubes” by Tamberly Powell is licensed under CC BY-NC-SA 4.0
- Figure 4.36. “Dental caries” by Alice Callahan is licensed under CC BY-NC-SA 4.0, “cavity” by Suyash.dwivedi is licensed under CC BY-SA 4.0,
- Figure 4.37- Fig 4.39. “Yogurt and label images” by Tamberly Powell is licensed under CC BY-NC-SA 4.0

