At this stage, you’re probably carrying out your planned intervention or action and gathering data to address your research question. Many newcomers to action research believe that analysis should only start after all the data has been collected.
An interim analysis is part of the continuous, ongoing data analysis. It is part of the ongoing reflective planning process of action research (Hendricks, 2013).
Your action research projects will typically involve both quantitative and qualitative data. The methods for simplifying quantitative data, such as reporting, comparing, and displaying data, differ significantly from those used for qualitative data, which include analyzing the data to identify patterns and themes.
New researchers often feel disappointed when their interventions don’t lead to the anticipated results. However, even in these situations, exploring the data to understand why things didn’t work as expected can provide valuable insights. This process can guide you in refining your intervention to achieve better results in the future.
Remember!
Action research is an iterative process so what you learn from this cycle of your research project will inform your next iteration of action research.
Analysis of Quantitative Data:
Reporting & Comparing
Quantitative data is usually gathered via:
- Test scores
- Rubric-scored work
- Checklists
- Tally sheets
- Behavioural scales
- Attitude scales
- Closed-ended survey items
Even though specific data from some of these data-gathering tools are not quantitative in nature (numerical), the data can be analyzed quantitatively.
For example: Counting or averaging the number of responses for each item.
- Closed-ended responses (strong, average, weak) can reflect counts for the number of respondents who chose each response.
- For the behavioural scale item, which includes numerical responses, the actual number chosen for each item could be tallied and the numbers could be averaged to describe results (Hendricks, 2013).
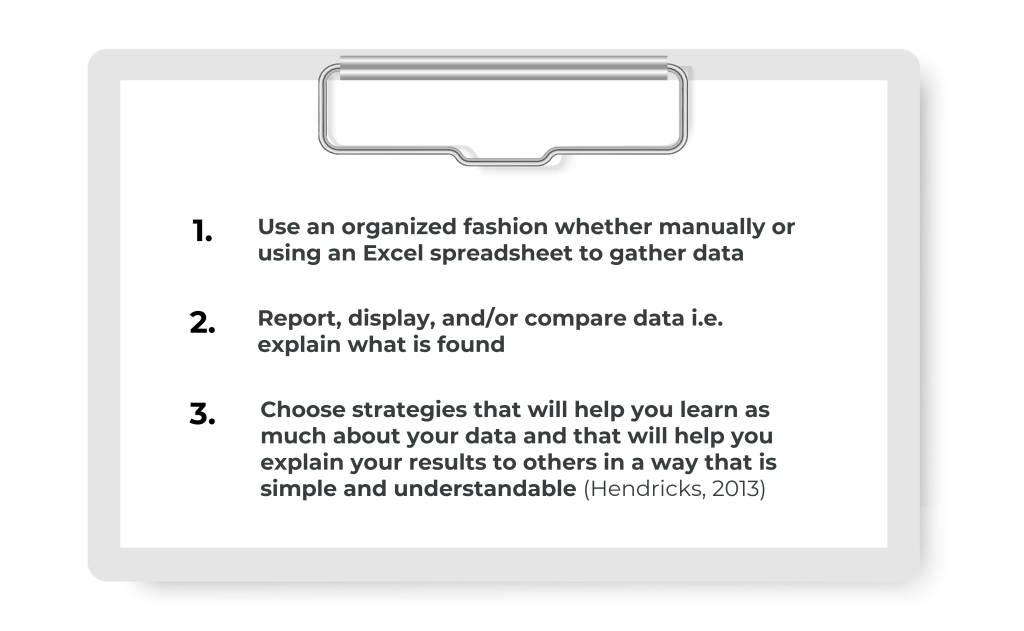
Quick Tips to Analyze Quantitative Data
“According to Shank (ibid) “themes do not emerge from data. What emerges after much hard work and creative thought, is an awareness in the mind of the researcher that there are patterns of order that seem to cut across various aspects of the data. When these patterns become organized, and when they characterize different segments of data, then we can call them ‘themes’.”
(Hendricks 2013)
Analysis of Qualitative Data: Looking for Themes & Patterns
Analysis of qualitative data is a process of making meaning from data sources that can be interpreted in several ways and helps answer the why questions.
These data sources can be explained and used to answer your research question only after they have been interpreted. This process requires a deeper analysis of data than those processes used to explain quantitative data sources (Hendricks 2013).
As research topics are identified, continue to engage in reflective and reflexive inquiry to clarify your understanding and beliefs about the topic, actions that might be taken, and outcomes that are desired (Hendricks 2013).
Verification
Verification is knowing when you “got it right.” Reaching valid conclusions in your study is a critical step in the action research cycle. Conclusions must be reasonable in light of the results obtained.
Quick Tips to Analyze Qualitative Data
| Write your research question(s). Refer to your research question(s) often as you go through the process of qualitative data analysis |
|
| Compile qualitative data sources. | |
| Convert non-textual data to textual form (e.g. audio or video recordings) | |
| Read text sources several times and over several days. Disassemble and code data. | |
| Create a codebook. Define codes and illustrate them with quotes or examples from text sources | |
| Look for themes as you reassemble data. Interpret results and write up major findings. Describe the patterns and themes specifically related to your research questions(s) |
|
| Look for ways that the results of the different types of data you have collected (artifacts, observations, and inquiry data) support each other |
(Hendricks 2013)
