It is easy to get overwhelmed with all the types and styles when it comes to formulating survey questions. It is important to keep in mind that every question counts.
Let’s explore some of these question types/formats.
Interactive Book
Survey Questions – Types & Purpose
Click the previous/next arrows to move between the page or use the table of contents menu.
Rating Scales
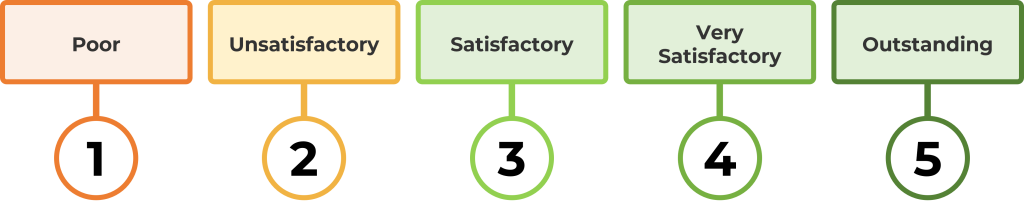
Many surveys use closed-ended questions that require respondents to rate attitudes, perceptions, and/or behaviours. Rating scales are appropriate when asking individuals to respond to a set of questions where their response indicates the strength (e.g. the extent of agreement, level of frequency, degree of understanding) of that response.
A rating scale requires respondents to place the item being rated in any one of an ordered series of categories or at some point along a continuum. A numerical value is assigned to the ordered categories or points.
There are three types of rating or measurement scales.
Type 1: Categorical
Also called ‘Nominal’ response scales
These require people to affirm or name the groups to which they belong: gender, religious affiliation, college last attended.
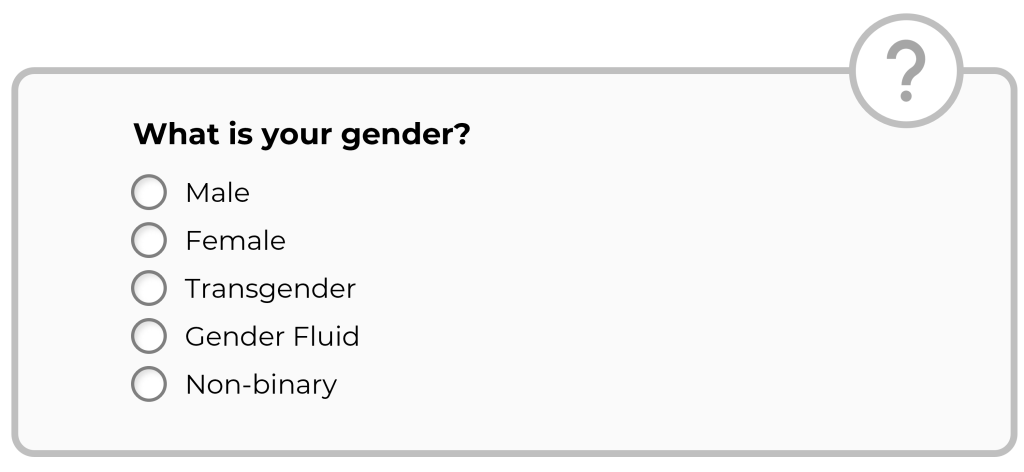
Image Description
The example above shows the question “What is your gender?” with the following options: Male, Female, Transgender, Gender Fluid, and Non-binary.
Type 2: Ordinal
These scales require that respondents place answers in order of importance. When raters use Ordinal scales, they select one of a limited number of categories that have some order in them.

Image Description
The example above shows the question “What is the highest level of education you completed?” with the following options: Elementary School, High School, College diploma/degree, University undergraduate degree, and Graduate degree.
An often-used ordinal scale is the Likert or Likert-like scales. Likert scale begins with a statement and then asks individuals to respond on an agree / disagree continuum. This typically ranges from strongly agree to strongly disagree (Hendricks, 2013; Mertler 2020). Likert-type scale also exists on a continuum but something other than extent of agreement is being measured. For example, a question could examine frequency of occurrence or quality of an experience or level of comfort (Hendricks, 2013; Mertler 2020).
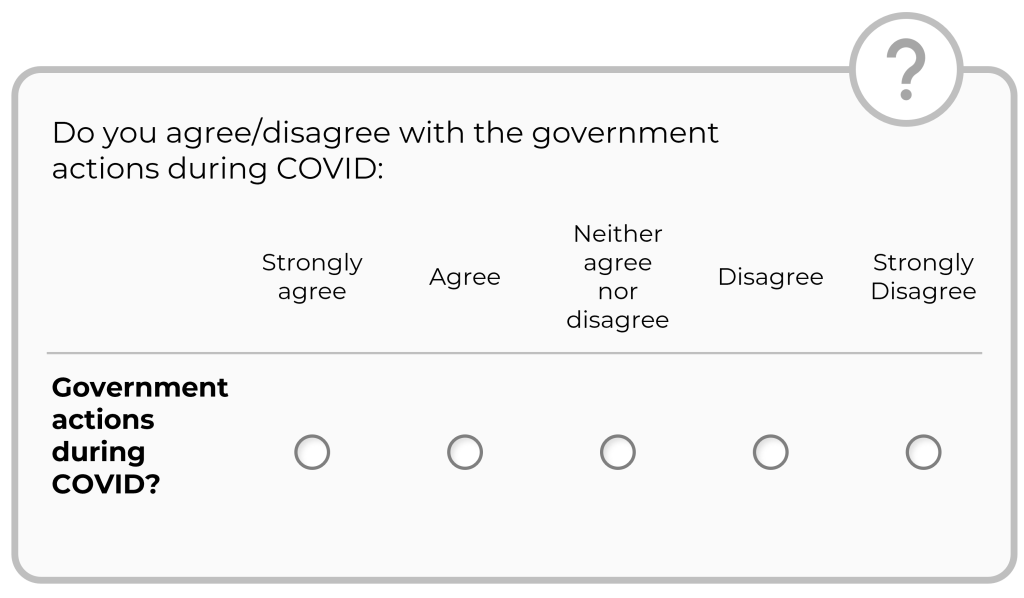
Image Description
The example above shows the question “Do you agree/disagree with the government actions during COVID?” on a Likert scale of approve/disapprove with the options: Strongly agree, Agree, Neither agree nor disagree, Disagree, and Strongly disagree.
Ordinal scales are easy to use and interpret or make sense of. There are questions raised about how many categories should be used. Some researchers suggest using as many as nine categories and others as few as three. But, it is the needs of the survey and skills of the respondent, which determine the number of categories.
If precise information is needed and the respondents are willing and able to give it (i.e. time respondents willing to spend answering the survey), and you have the resources to collect it, use more categories (between 7 and 9); otherwise use fewer (Fink, 2017).
Type 3: Numerical
This scale takes two forms: discrete and continuous.
A discrete scale produces a precise number, whereas a continuous scale produces a number that falls on a continuum.
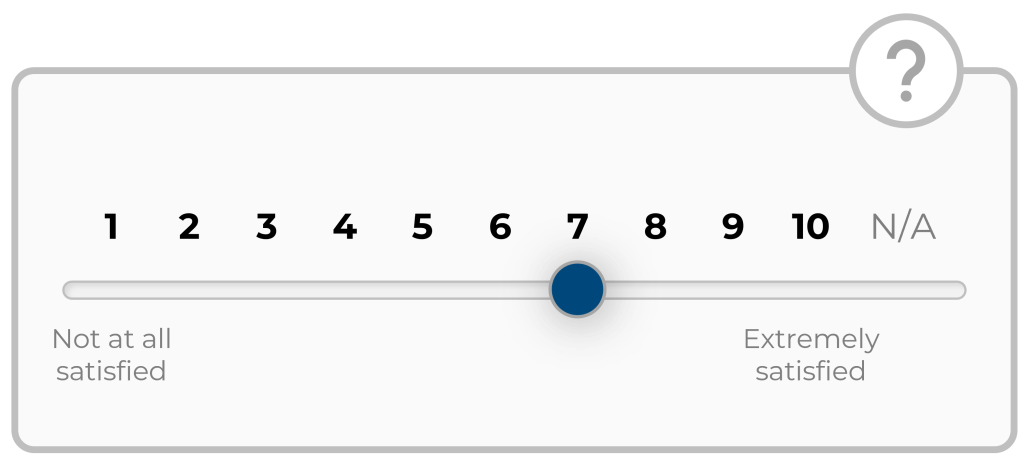
Image Description
The question above allows the respondent to select a level of satisfaction of a numerical scale from 1 to 10 where 1 indicates Not at all satisfied and 10 indicated Extremely satisfied. There’s also an option for selecting N/A.
Continuous data can have almost any numeric value and can be meaningfully subdivided into finer and finer increments depending on the precision of the measurement system. You can also use graphic scales to get continuous data.
- Graphic scales are a kind of rating scale in which the continuum of responses is visual. For example, a well-known graphic scale is that which is used to describe pain a person experiencing. They are asked to place a mark on a scale or indicate a number that best illustrates his or her pain (Fink, 2017).
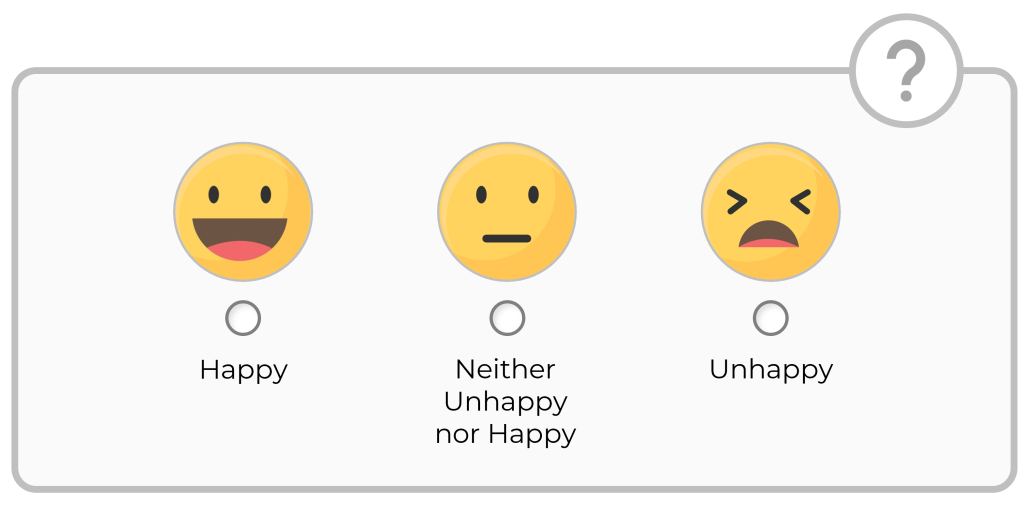
Image Description
The example above represents three options for a question that requires a selection of happiness levels. The options are Happy, Neither Unhappy nor Happy, and Unhappy.
The distinctions among categorical, ordinal, and continuous scales are important because they determine the kind of statistical treatments you can use when it comes to your analysis.
For example,
- If you want the average score for continuous data you would use the arithmetic average for the mean. For ordinal data, you might consider calculating the median or the number separating the higher half of responses from the lower half.
- For nominal data, the only real statistical measure that can be used to analyze responses is the mode. (Fink, 2017).
QUALTRICS also provides over 100 different ways to ask a question. There are many question types and a variety of settings that can be used to access each of these possibilities. The Qualtrics question types page provides a brief description of each with links to pages where you can learn more.
Read the Survey Creation section from the article The Ultimate Guide to Surveys to find out more about the different types of survey questions!
Additional Resources
- How to Design Rating Scale Questions
- 15 Common Rating Scales Explained
- Is a Three-Point Scale Good Enough?
- Do Too Many Response Options Confuse People?
- Should All Scale Points Be Labeled?
- Rating Scale: Definition, Survey Question Types and Examples
