Using Colours to Convey Information

Why we should avoid using colour alone?
Relying on colour alone to express information poses barriers to access for many readers; colorblind and low vision people may not be able to notice the colour distinctions. Also, screen readers do not declare colours to non-sighted readers.
So what should we do to make it accessible?
- Have a supplementary indication that text is connected, such as underlining, bolding, or placing it on a different colour background rather than merely using another colour.
- Don’t just change the colour of an element in a chart or graph to differentiate it. Change the shape, pattern, or something similar.
- Provide a text alternative for complicated charts and graphics.
Example 1 – Making graphs more accessible using colours and shapes
Here is an example of what should not be done:
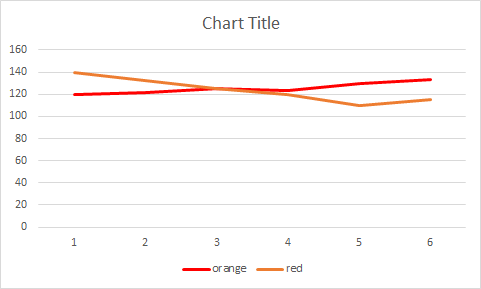
What’s wrong with this example?
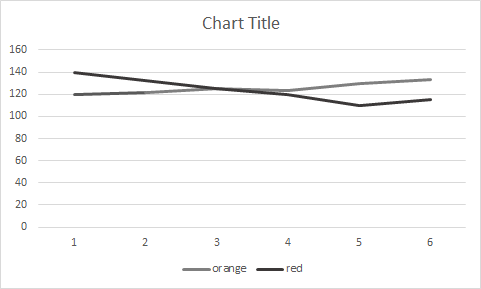
There is no text alternative, and the colour is the only way to relate the data series to the values in the line graph. As we can see in the below graph, a colour-blind person would be able to differentiate the data series.
So how can we fix it?
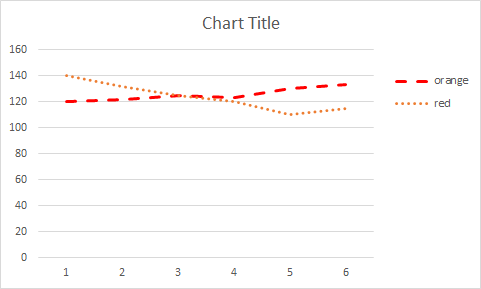
Here are some ways to fix it:
- Along with colour, the lines can be distinguished by the geometry of the vertex points and a hash pattern.
- Labels and lines are visually connected. As we can see, the “orange” and “red” lines are right next to their labels.
- A text-only alternative is offered, such as the source data.
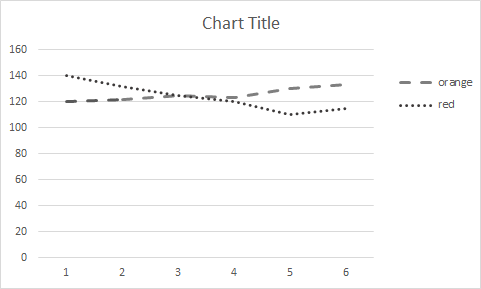
Without colour, it might be difficult to understand this, but it is still possible to detect the lines based on their shape and label closeness, then follow them to the opposite vertex shape that matches them. However, by presenting the table, a user faced with this difficulty or a screen reader user might alternatively quickly scan the table.
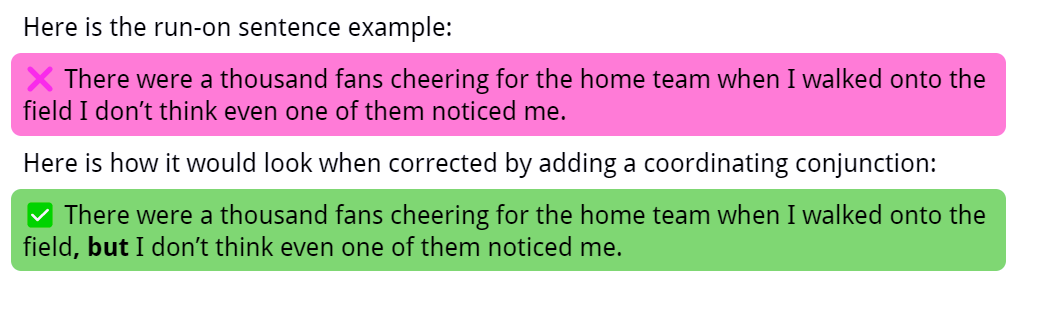
Example 2: Colours that indicate right and wrong answers
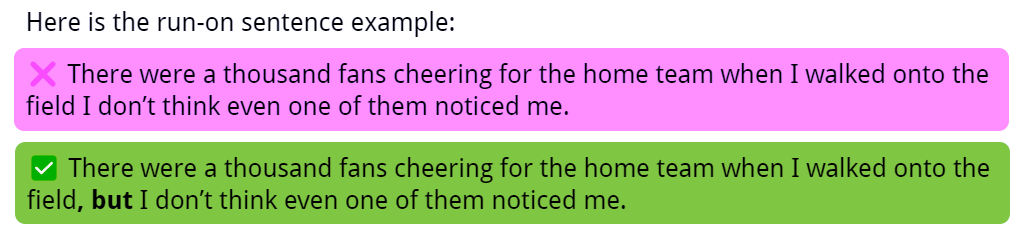
To fix it, always put some text so it can be clear to everyone. As we can see below, text indicating that the second sentence in green is correct was inserted above it.
Exercise:
References:
- Accessibility color alone as meaning. (n.d.). Retrieved December 13, 2022, from https://www.w3schools.com/accessibility/accessibility_color_meaning.php
- The Trustees of Princeton University. (n.d.). Avoid using color alone | digital accessibility at Princeton. Princeton University. Retrieved December 13, 2022, from https://accessibility.princeton.edu/how/content/color-alone
- Webguide. (2022, August 4). Underlined text. Webguide. Retrieved December 13, 2022, from https://www.boisestate.edu/webguide/accessibility/mastering-web-accessibility/underlined-text/