Tables

Headings and summaries are crucial
Tables are visually formatted in a grid of data, and this style gives the data context. A sighted user can easily ascertain the purpose of the table and which rows and columns are the data headers, thanks to visual formatting. The addition of headers to the table adds another level of comprehension of the table’s data columns. There must be counterparts in programmatic code for each attribute of a table’s visual presentation for non-sighted users because screen readers will rely on this code to help the user differentiate and define the data in the table.
So how can we make tables accessible?
PS. Don’t worry if you don’t know how to code. Most software and applications will have tables which are already accessibly formatted or additional options to modify the table to make it more accessible. These options help ensure that the programmatic code is available and make tables more accessible.
- Create clear column and row headers to improve the table’s semantic clarity.
- Add a summary of the table’s contents and objectives that the screen reader will read aloud to the non-sighted user.
- Tables should not be used as layout tools because they will confuse users who are blind.
Examples:
First, let’s go for an example of a bad table:
| Date | Event | Venue |
| 12 January | The Nutcracker | West Wing hall |
| 25 February | The Magic of Oz | Main hall |
| 03 March | Beethoven | Main hall |
Why is this example wrong?
Despite the fact that we created headers visually, it does not specify column or row headers for the table. There is no tabular summary, either. Data fields in this table are related to the subject of the row and column headings, which is clear to a sighted user. A sighted user can quickly recognize the content’s nature as a listing of concert details, but a non-sighted user would need to start listening to the cells in order to decide whether the information is helpful because there is no table summary.
And now, let’s fix the previous table fixed:
Summary: Timetable of concerts showing its date and venue. Column one has the date of the event, the second column the name of the event/concert and the last one the venue where it will be taking place.
| Date | Event | Venue |
|---|---|---|
| 12 January | The Nutcracker | West Wing hall |
| 25 February | The Magic of Oz | Main hall |
| 03 March | Beethoven | Main hall |
We can see that the table delivers a programmatically equal degree of access to the non-sighted user via a screen reader, which satisfies success criteria 1.3.1 and is completely compatible with WCAG AA standards. Row and column headers are clearly marked, and the data table’s goal is summarised in the summary.
Each software, like Word, PressBook, etc, has a way to set the headers on tables. All you need to do is to identify those headers and set them programmatically.
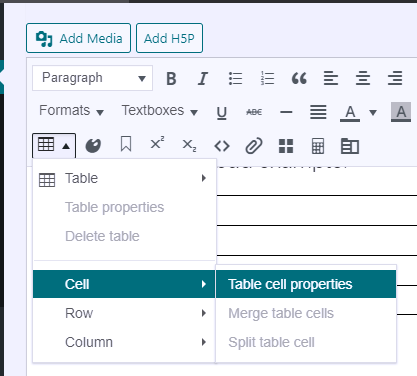
In this example, PressBook was used to fix it. For that, first, you select the cell you want to make as a heading, then you go to the table icon on the left side, on top of the screen, then Cell and then Table cell properties as in the image below.
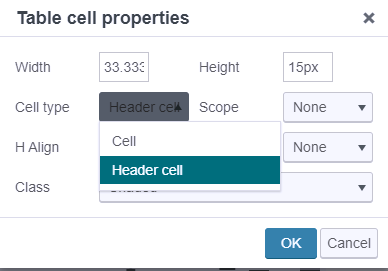
And lastly, choose Header cell on the Cell type box.
Exercise:
References:
- (WAI), W. C. W. A. I. (n.d.). Caption & summary. Web Accessibility Initiative (WAI). Retrieved December 13, 2022, from https://www.w3.org/WAI/tutorials/tables/caption-summary/
- The Trustees of Princeton University. (n.d.). Tables | digital accessibility at Princeton. Princeton University. Retrieved December 13, 2022, from https://accessibility.princeton.edu/how/content/tables